Market Sizing Framework for Strategic Market Analysis (Free Template)
Master TAM, SAM, and SOM calculations for strategic market analysis. Free PDF and PowerPoint templates included. Essential for strategy consultants.


Understanding TAM, SAM, and SOM
Market sizing is a fundamental component of strategic analysis. Whether you're developing a business case, evaluating market entry opportunities, or presenting to stakeholders, accurate market assessment provides the foundation for decision-making.
This framework breaks down market sizing into three distinct metrics that work together to provide a complete picture of market opportunity.
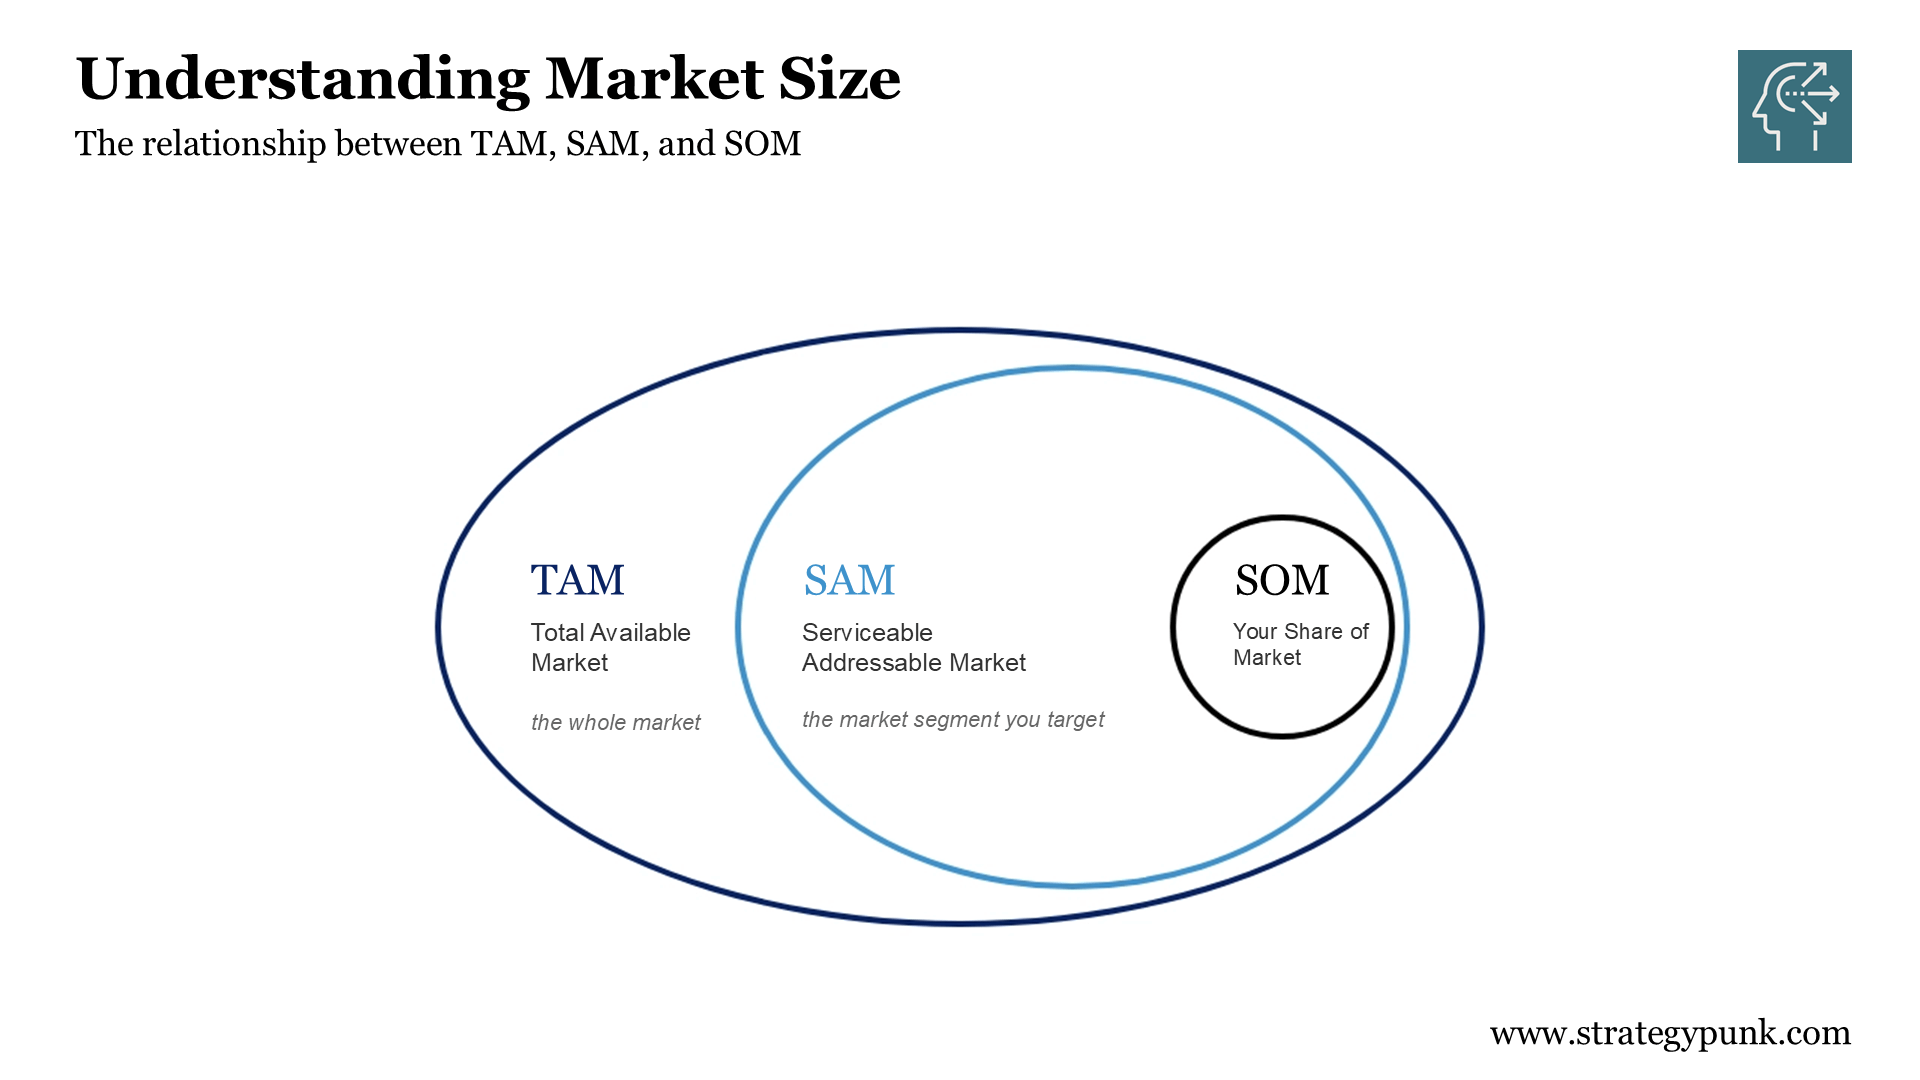
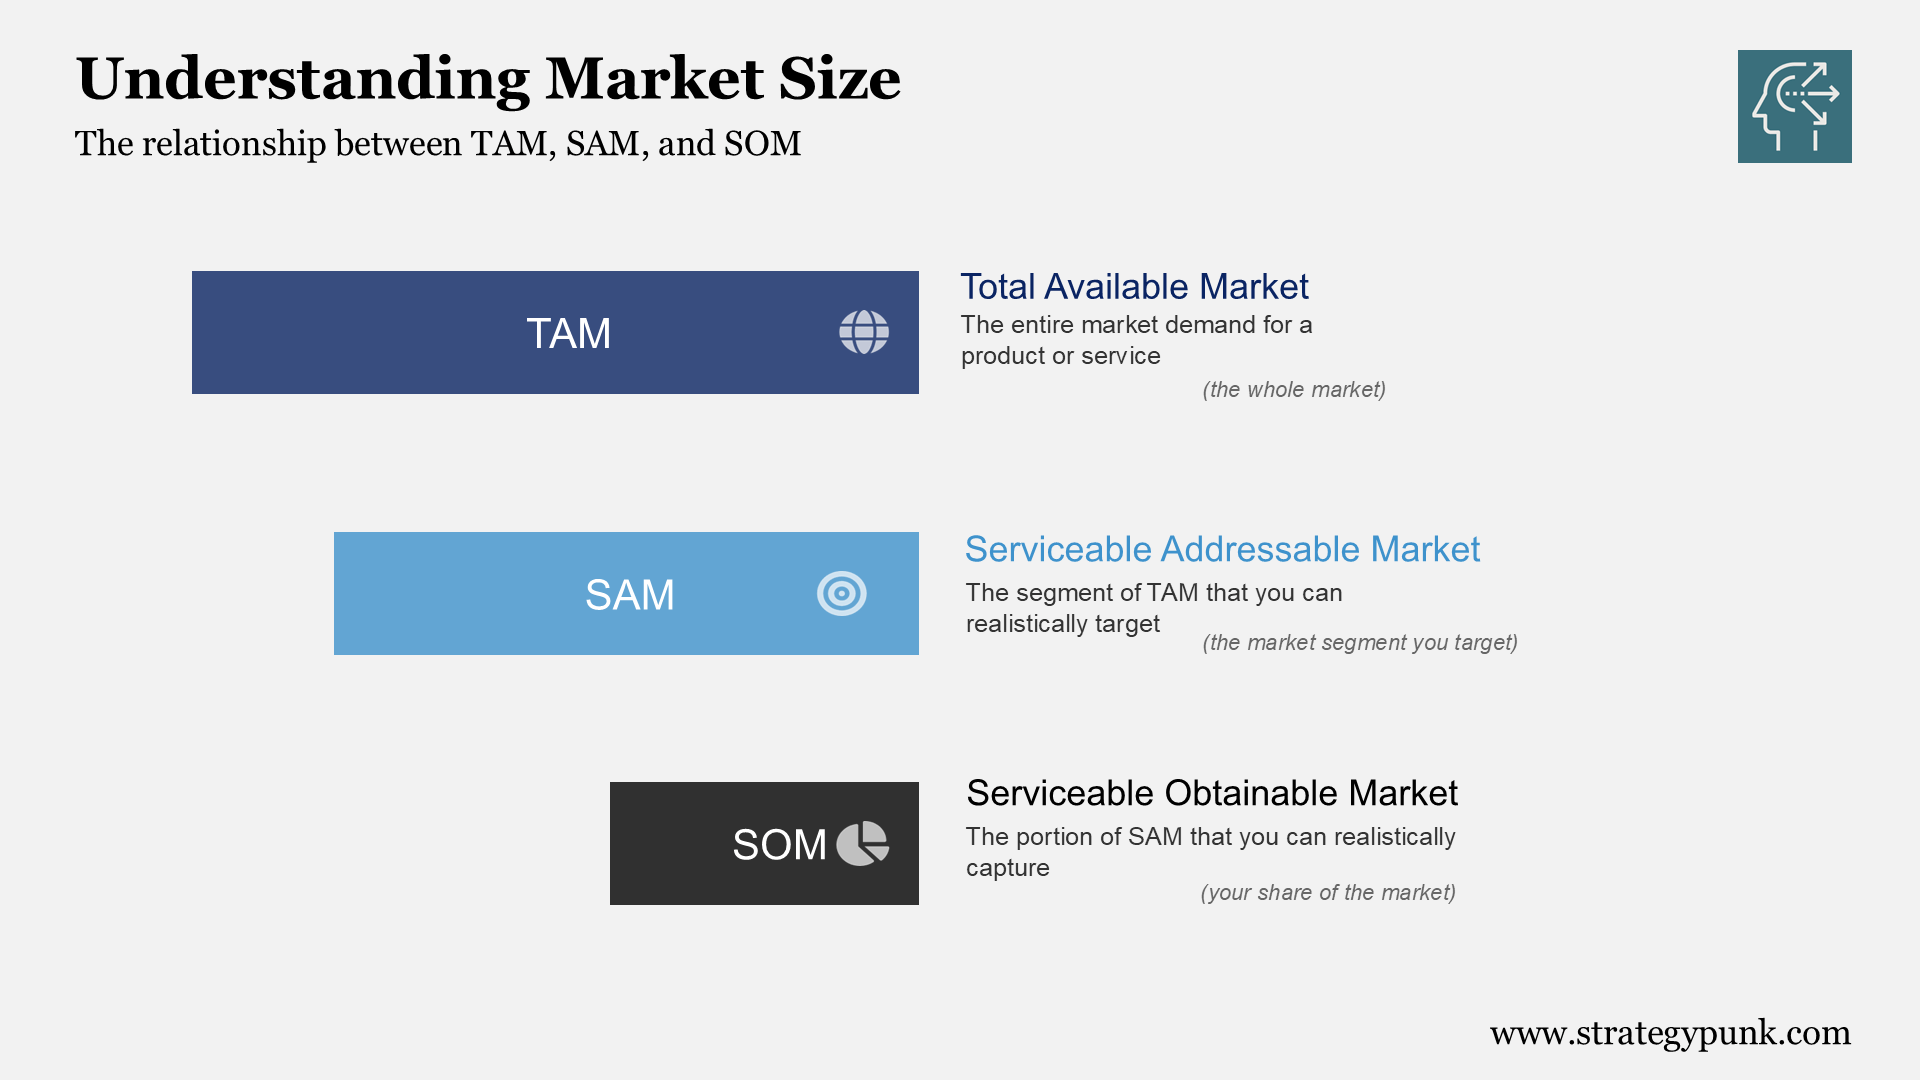
The Three-Layer Market Model
Market sizing uses three concentric layers, each representing a different scope of opportunity.
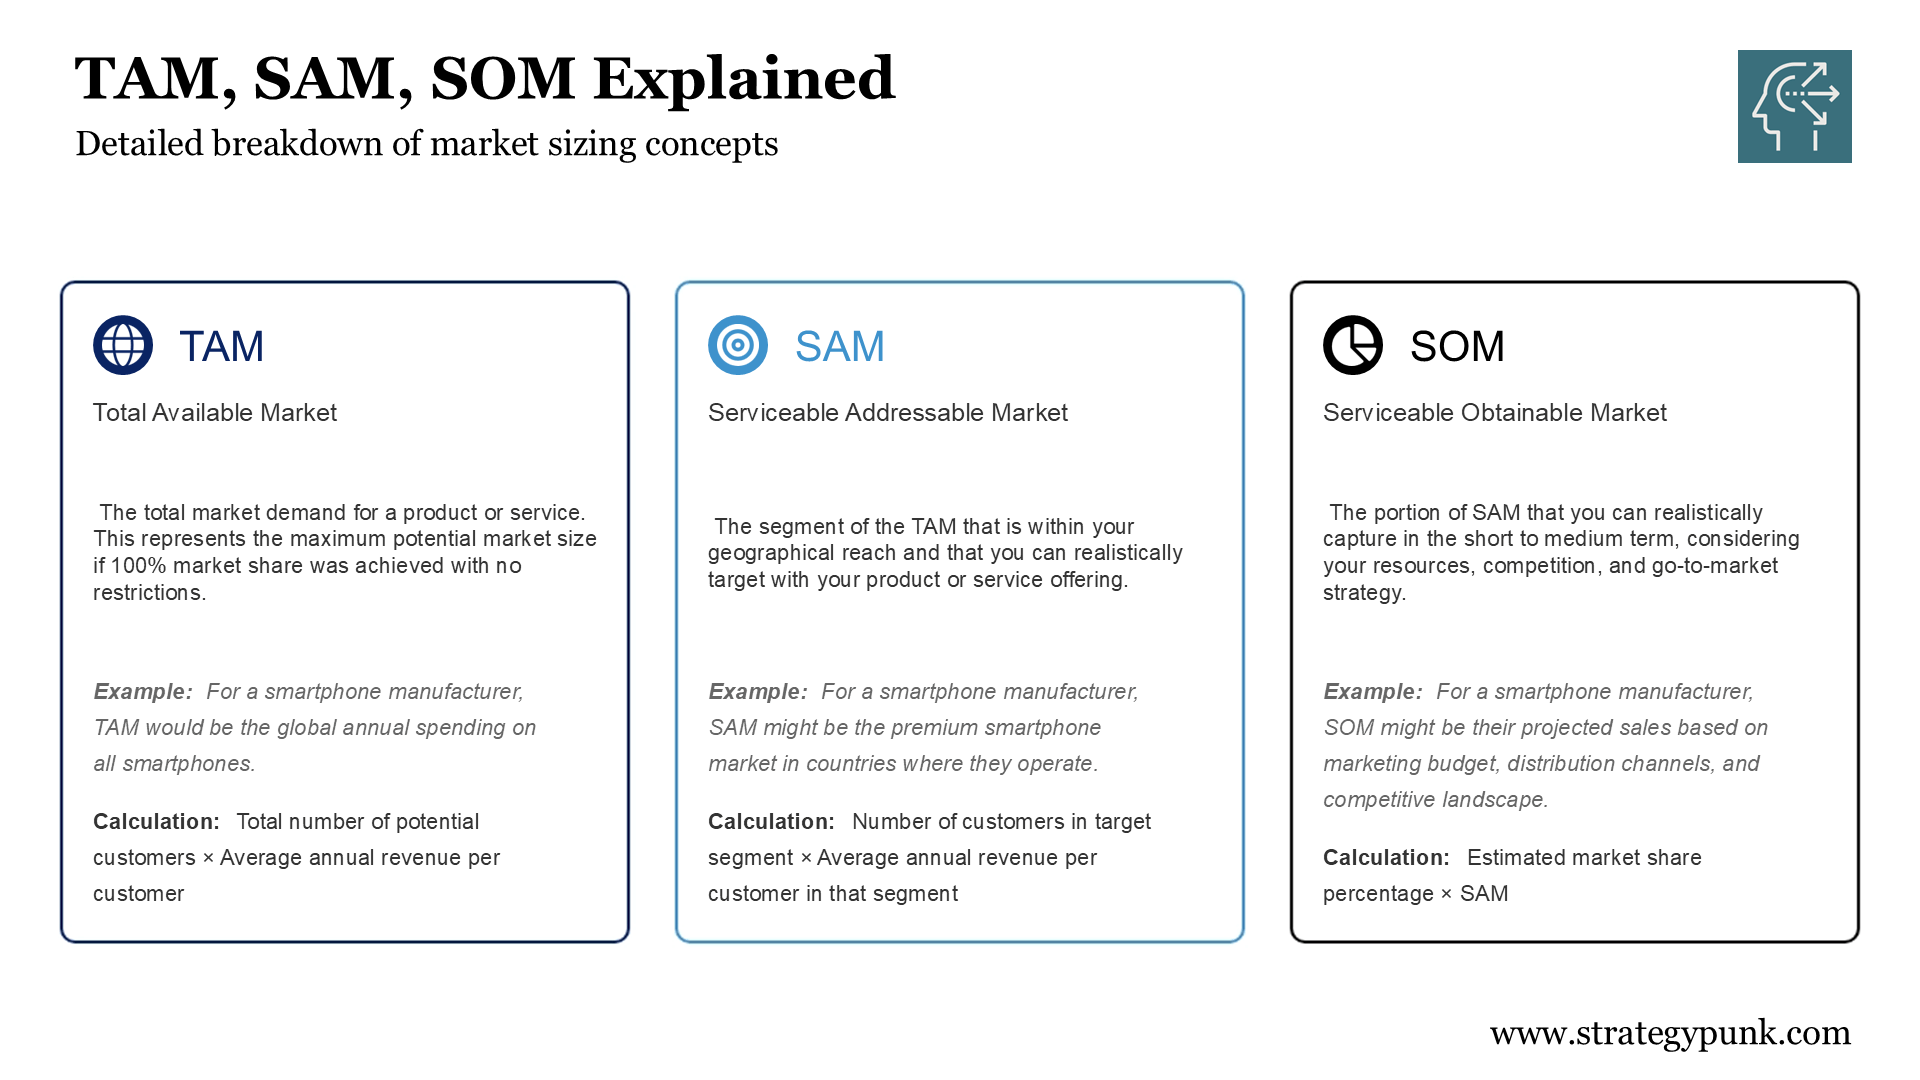
Total Available Market (TAM) represents the entire demand for a product or service. This is the theoretical maximum if your solution captured 100% of all relevant spending with no geographic, regulatory, or operational constraints. For a smartphone manufacturer, TAM would be the global annual spending on all smartphones.
A Serviceable Addressable Market (SAM) narrows down to the segment you can target, given your business model, geographic reach, and product offering. The same smartphone manufacturer might define SAM as premium smartphones in operational markets. This excludes segments outside their price range and regions where they lack distribution.
Serviceable Obtainable Market (SOM) represents the realistic capture within a defined timeframe. This accounts for competition, go-to-market resources, and market penetration rates. SOM is your projected market share applied to SAM.
Why This Approach Matters
The framework serves several purposes in strategic planning.
First, it distinguishes between total opportunity and addressable opportunity. Many analyses fail to differentiate between market size and market access. A trillion-dollar industry means nothing if you can only reach 0.1% of it.
Second, it creates a testable set of assumptions. Each layer requires different inputs and reveals different constraints. TAM depends on category definitions. SAM depends on targeting decisions. SOM depends on execution capabilities.
Third, it aligns internal and external communication. Leadership needs to see the total addressable market (TAM). Operations need to plan for realistic targets (SOM). The framework enables you to address both audiences with consistent data.
Calculation Methods
Each metric uses a distinct calculation approach.
TAM Calculation: Total potential customers × Average annual revenue per customer
This requires defining the total addressable population and average spending within the category. Data sources include industry reports, government statistics, and market research.
SAM Calculation: Customers in target segment × Average annual revenue per customer in segment
This requires defining your target segment by geography, demographics, price point, or use case. The calculation narrows the customer base and may adjust the revenue figure if your segment has different spending patterns.
SOM Calculation: Estimated market share percentage × SAM
This requires projecting realistic market penetration based on competitive positioning, distribution capabilities, and marketing investment. Most new entrants should model conservative share estimates (1-5% in competitive markets).
Application in Practice
The framework applies across multiple business contexts.
Business Planning: Use all three metrics to show market scope (TAM), targeting strategy (SAM), and financial projections (SOM). This demonstrates both opportunity and realism.
Investment Analysis: Investors evaluate TAM for exit potential and SOM for near-term returns. A large TAM with modest SOM can still attract capital if the path from SOM to SAM is clear.
Strategic Prioritization: When evaluating multiple opportunities, compare SOM figures rather than TAM. The market you can capture matters more than the market that exists.
Performance Tracking: As you execute, track SOM achievement against projections. Variance analysis reveals whether assumptions about competition, pricing, or market access need updating.
Common Pitfalls to Avoid
Several mistakes weaken market sizing exercises.
Top-down only: Starting with TAM and applying percentages down often produces unrealistic figures. Validate the bottom-up analysis to count actual potential customers.
Static assumptions: Markets evolve—competition shifts. Regulations change. Update your model as conditions change rather than treating initial calculations as fixed.
Oversized SAM: The most frequent error is defining SAM too broadly. If your business model, pricing, or distribution cannot serve a segment, exclude it from SAM regardless of how it affects the total.
Undersized SOM: Conservative projections are appropriate, but SOM should reflect genuine ambition backed by resource commitments. If your SOM seems too small to justify the effort, reassess the opportunity.
Building Your Analysis
Start with SOM rather than TAM. Define what share you can capture given realistic constraints. Work backward to ensure SAM supports that capture rate and TAM provides expansion potential.
This approach grounds the analysis in execution rather than aspiration. It produces numbers you can defend and plan against.
Template: The complete market sizing framework is available for download
Market Sizing Framework - Slidedeck (Free PPT and PDF Download)