BCG Matrix: Introduction and Excel Template

BCG Matrix Introduction
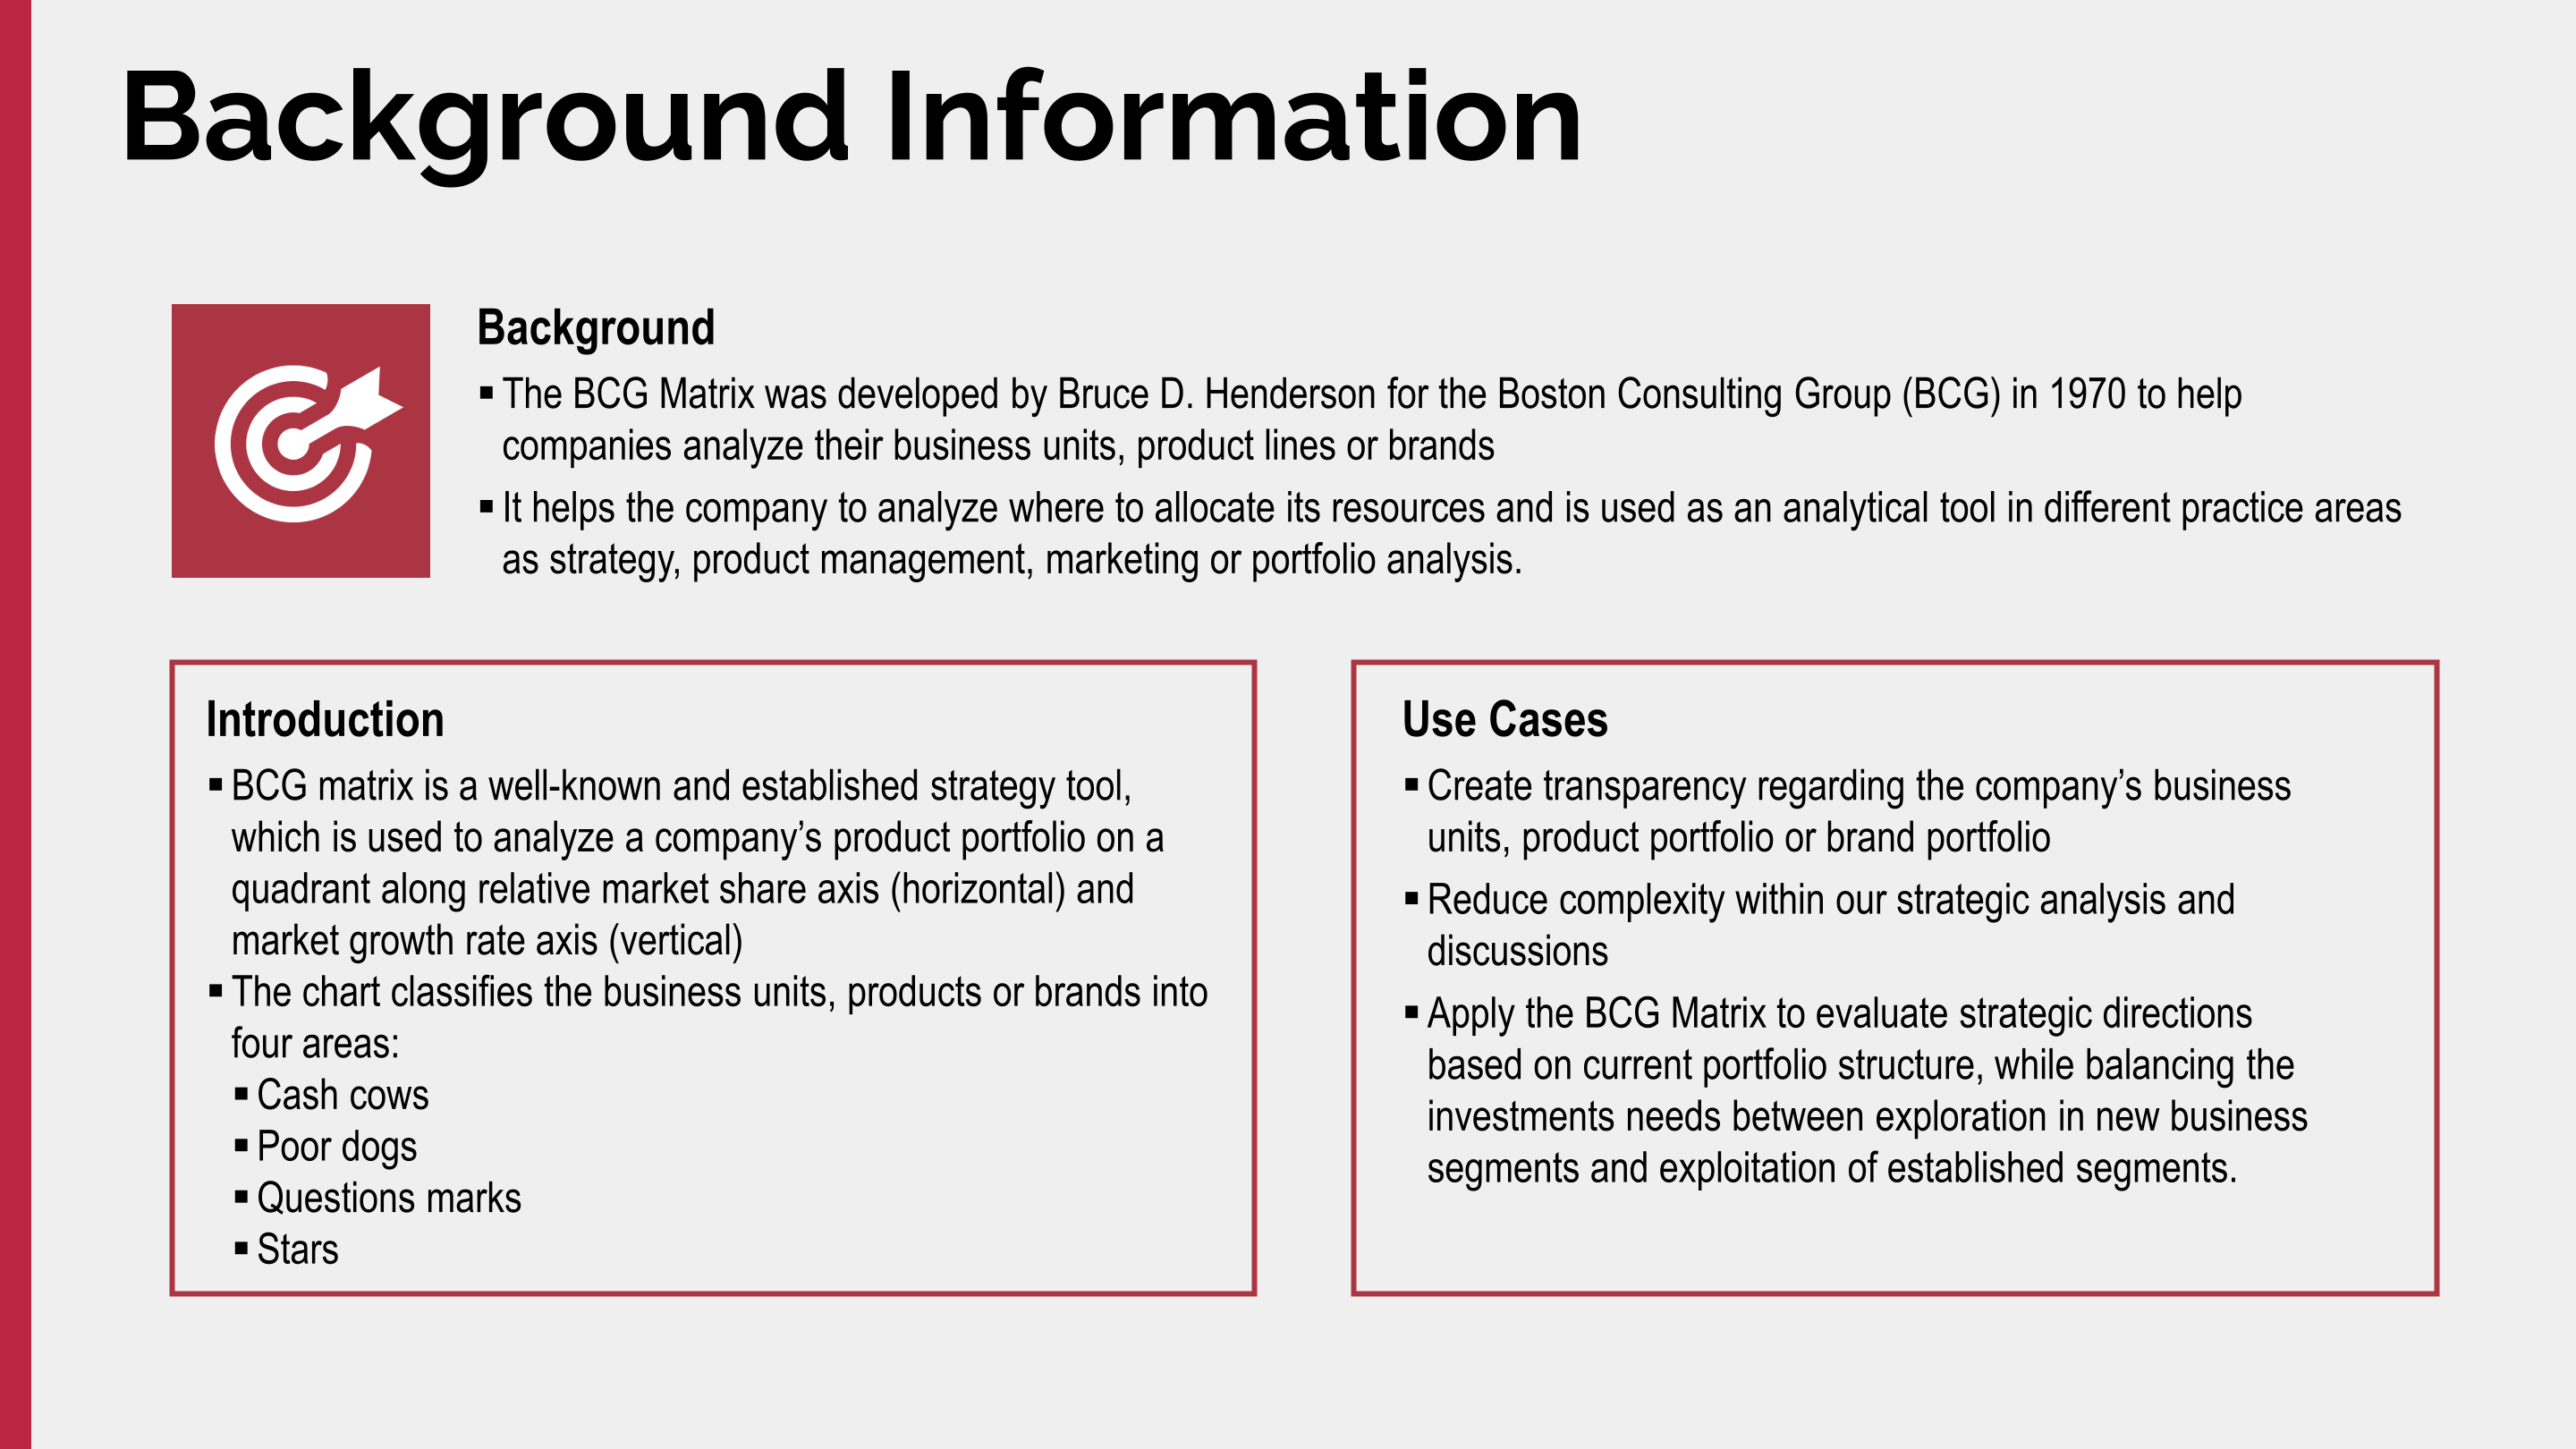
Bruce D. Henderson developed the BCG Matrix in 1970 for the Boston Consulting Group (BCG)to help companies analyze their business units, product lines, or brands.
It helps the company to analyze where to allocate its resources. It is an analytical tool in different practice areas such as strategy, product management, marketing, or portfolio analysis.
What Is the BCG Growth-Share Matrix?
Bruce Henderson developed the Boston Consulting Group BCG Matrix, also known as the BCG Growth-Share Matrix, 1970 as a portfolio management tool. If you have worked in an organization that implements business strategy frameworks, you will have encountered it.
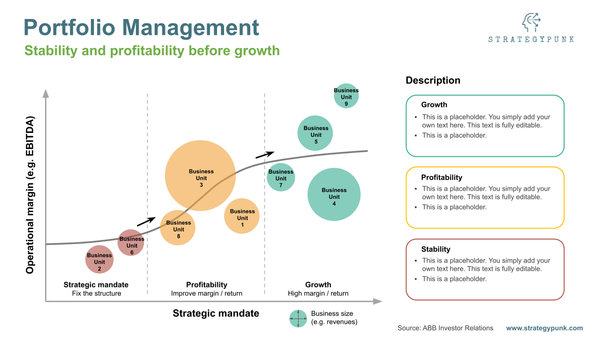
The Boston Consulting Group (BCG) Growth Share Matrix is a strategic framework used to analyze a business unit's market opportunities, growth potential, or product portfolio. It is one of the most popular tools for analyzing companies' market growth and market share and identifying new market opportunities.
The idea behind the BCG Growth-Share Matrix is that companies can try to position themselves in the market as either a “Star,” “Question Mark,” “Cash Cow,” or a “Dog.”
The BCG matrix helps decide how to allocate resources and prioritize business initiatives. It can also be helpful for strategic planning and forecasting cash flows.
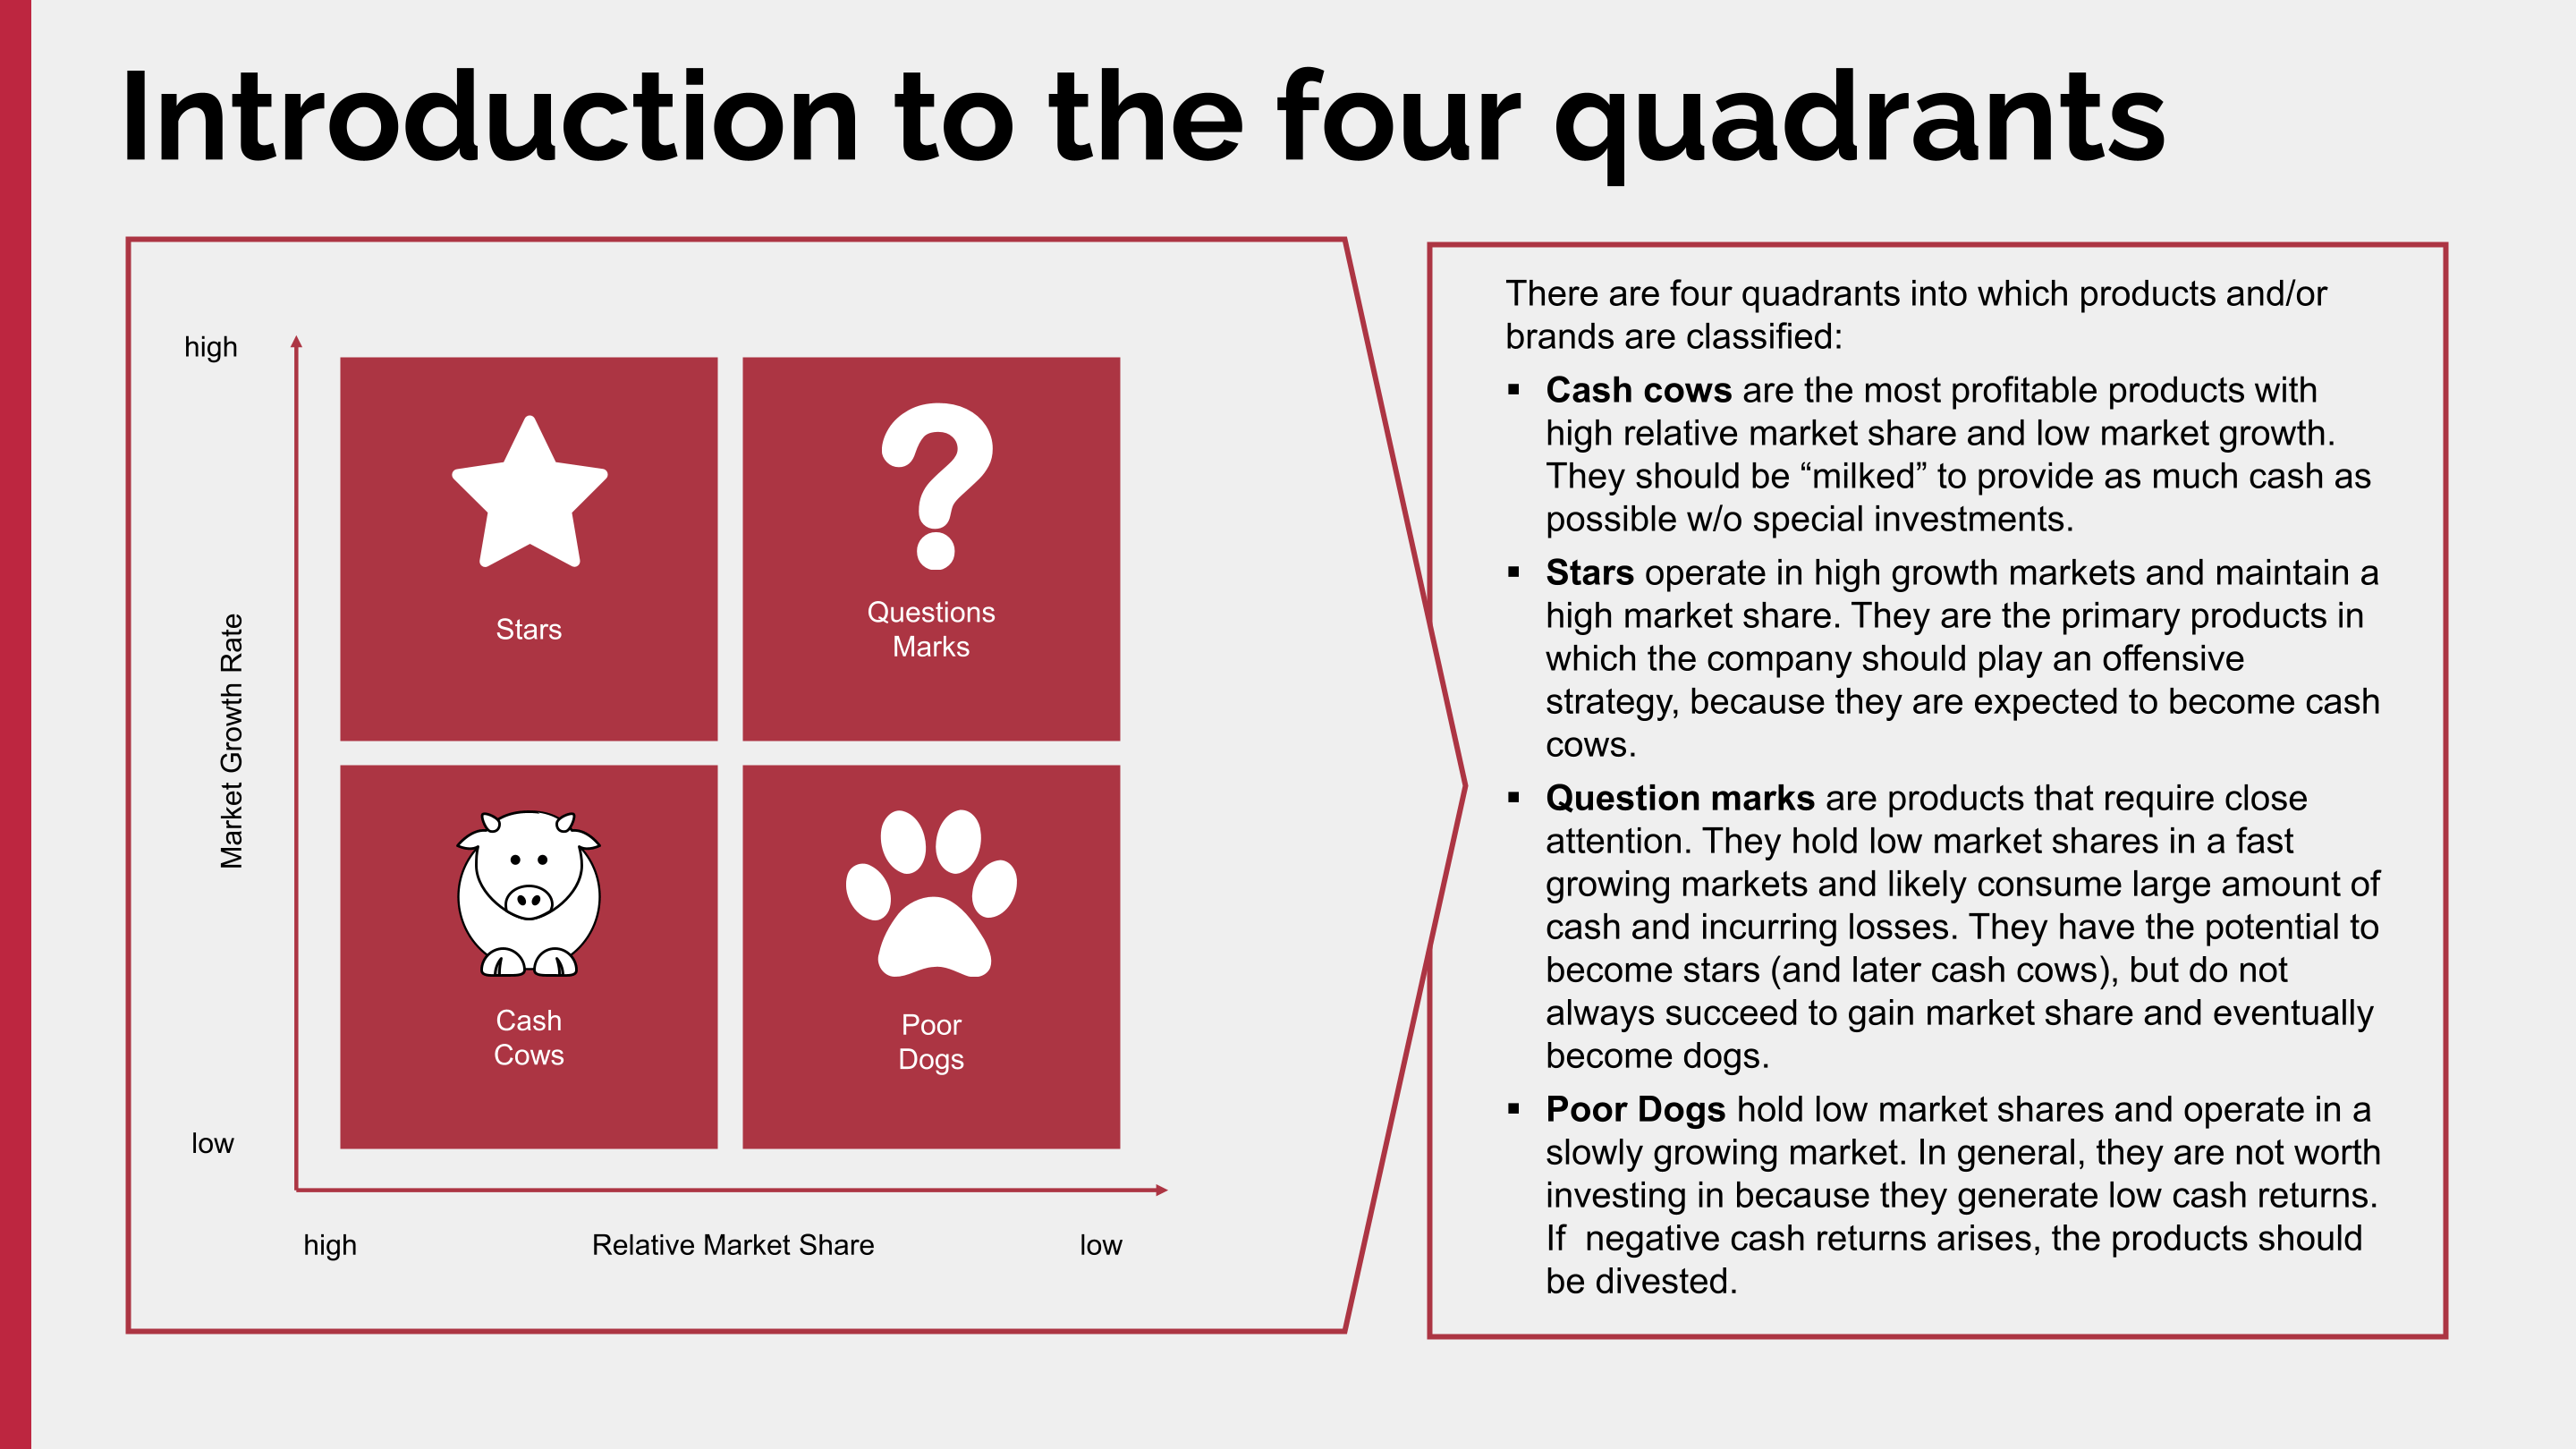
What are the four categories of the BCG matrix?
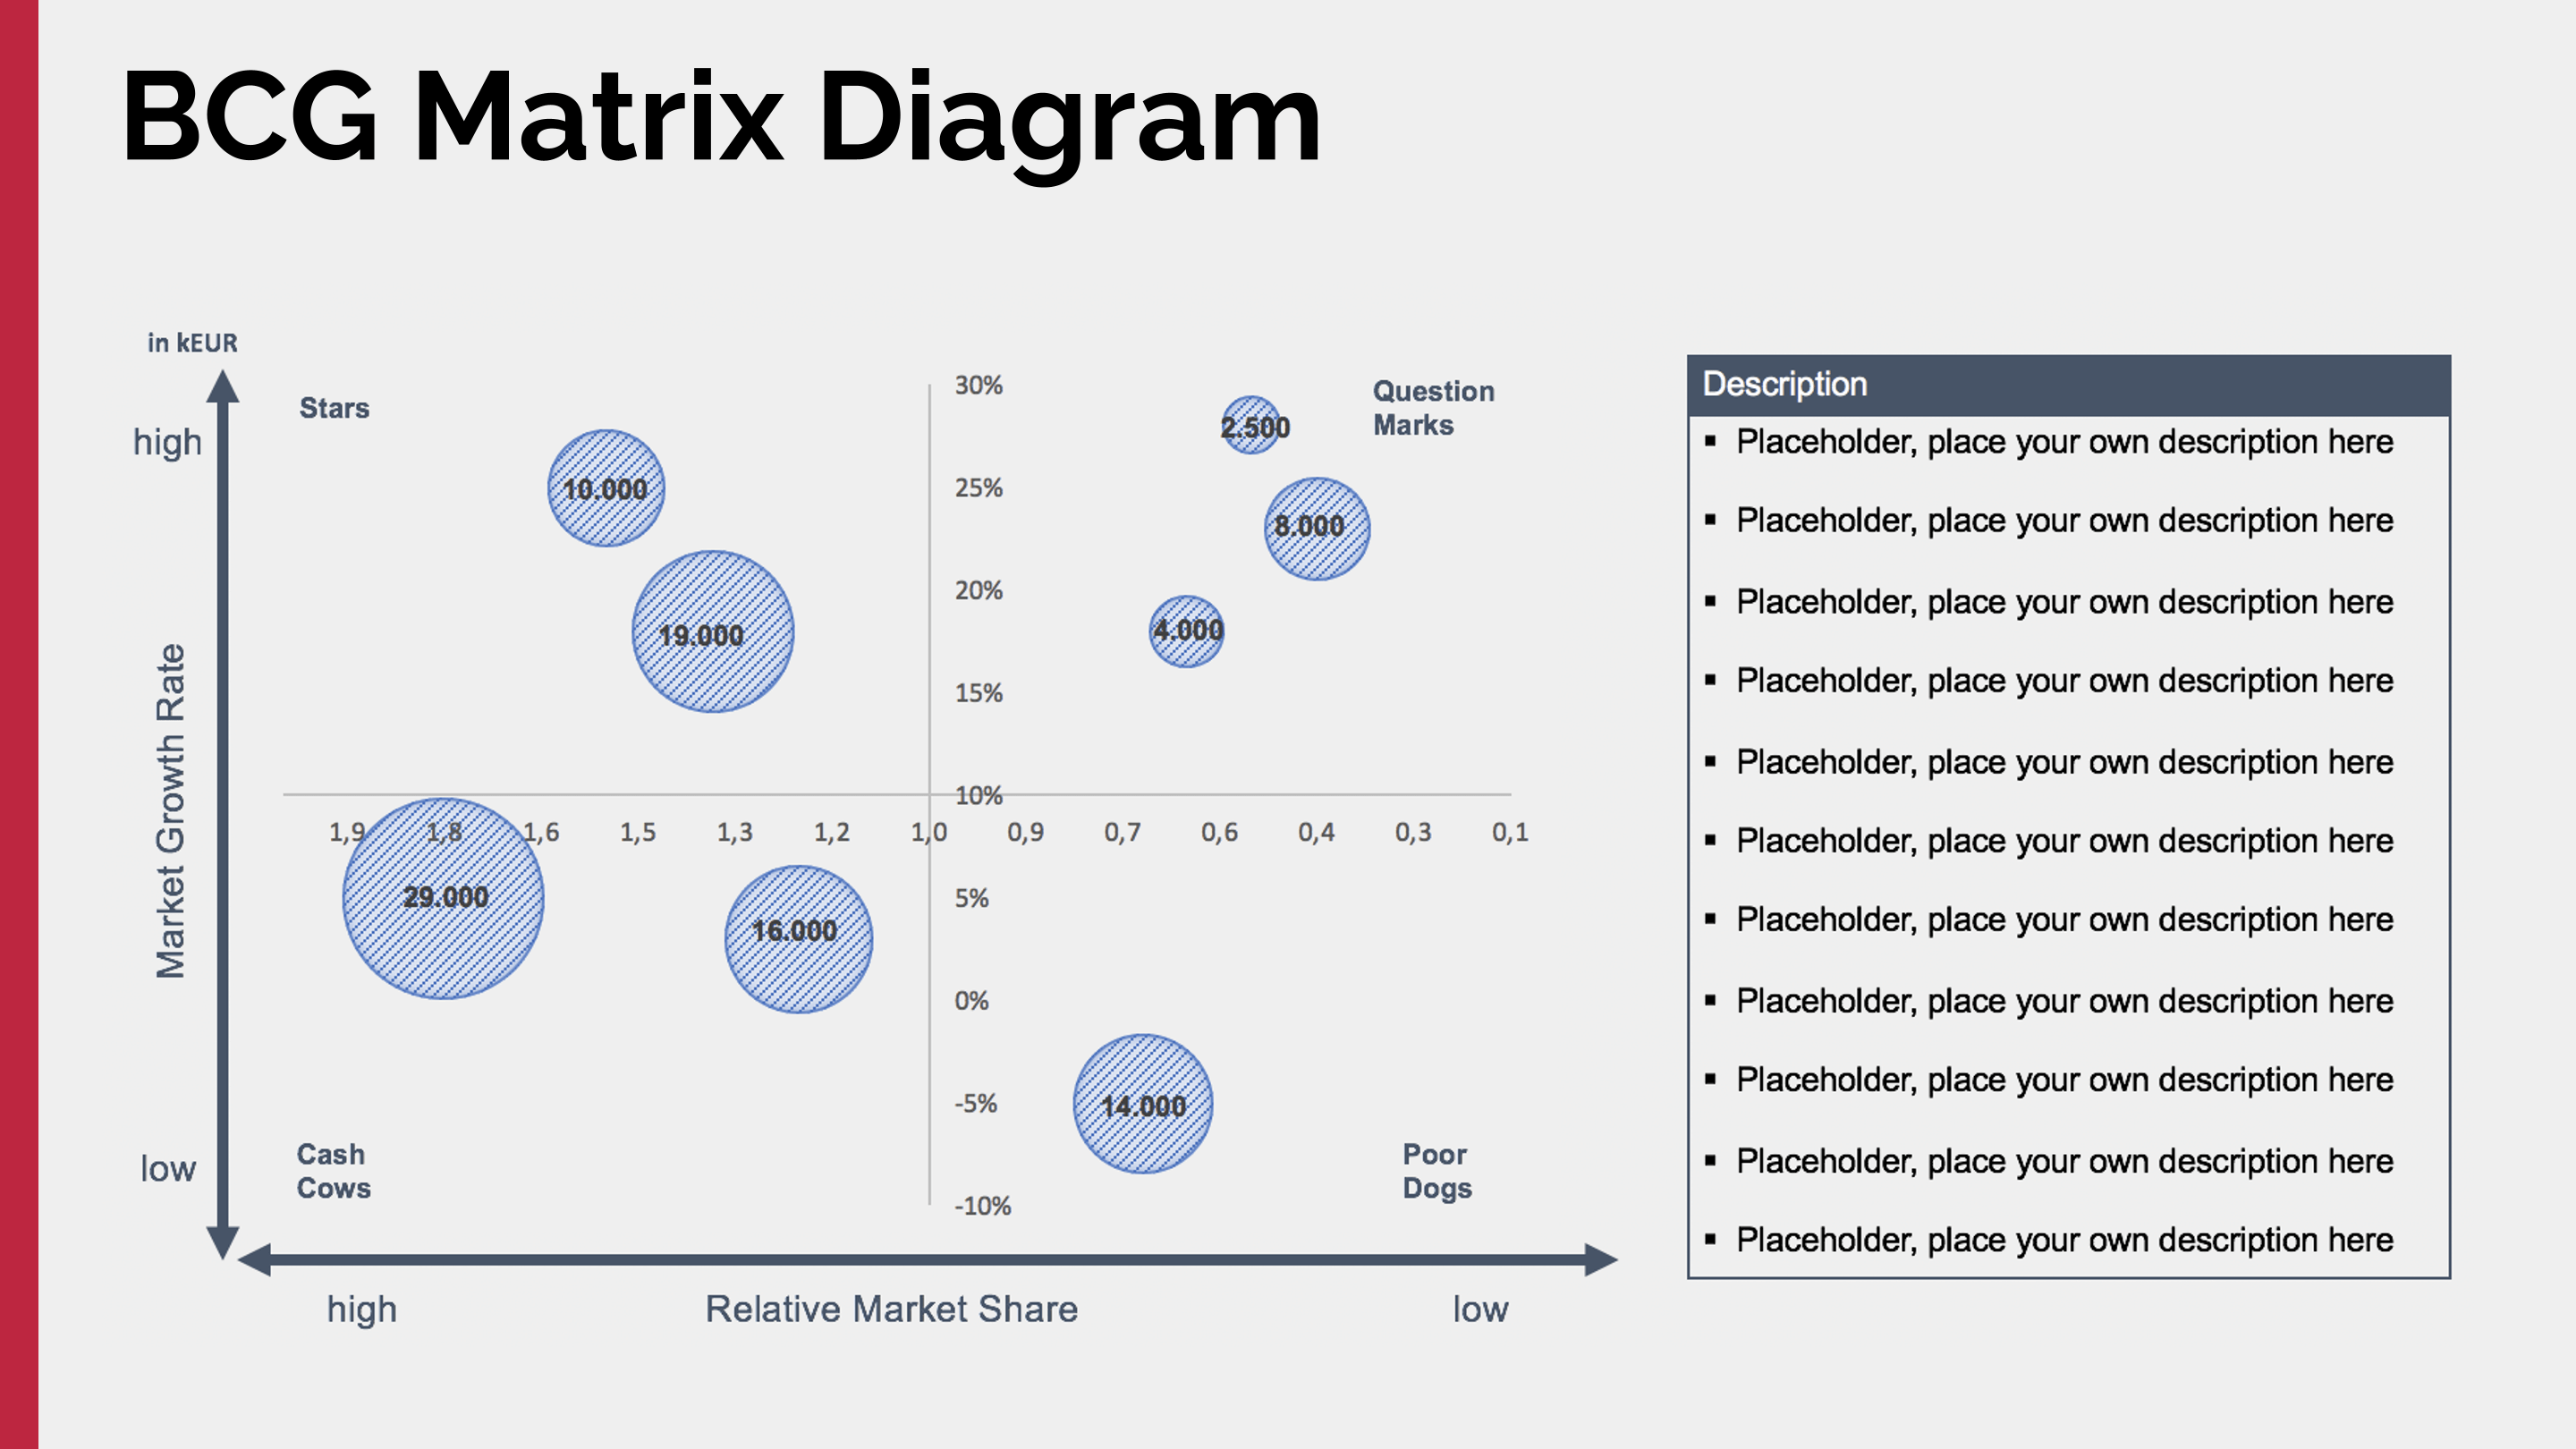
The four quadrants are designated Stars (upper left), Question Marks (upper right), Cash Cows (lower left), and Dogs (lower right).
The BCG Matrix: Stars
Products or Business Units in the star quadrant are in a rapidly rising market where the product(s) have a significant market share. These products are market leaders that require considerable expenditure to retain their position.
The BCG Matrix: Question Marks
Products or Business Units in the question marks quadrant are in a rapidly rising market, yet the product(s) have a small market share. While they are appealing, their future performance has yet to be discovered. As a result, the question mark.
The BCG Matrix: Cash Cows
Products or Business Units in the cash cows quadrant are in a slowly growing market with a significant market share. Reduce or continue stable investments to maximize the cash flow from these products or business units.
The BCG Matrix: Dogs
Products or Business Units in the dog's quadrant are in a slow-growing market with a low market share. Products in the dog's quadrant can usually maintain themselves and generate stable cash flows, but they will never reach the star's quadrant.
How to use the BCG Matrix?
The BCG Matrix is a helpful tool for any business to prioritize its activities. This can also be used within your company to decide which projects you want to take on, which clients you want to work with, or which services you should offer. This tool will also help you to decide how to focus your internal efforts to grow your business.
Each quadrant reflects a unique mix of relative market share and market growth. Just complete the following five steps:
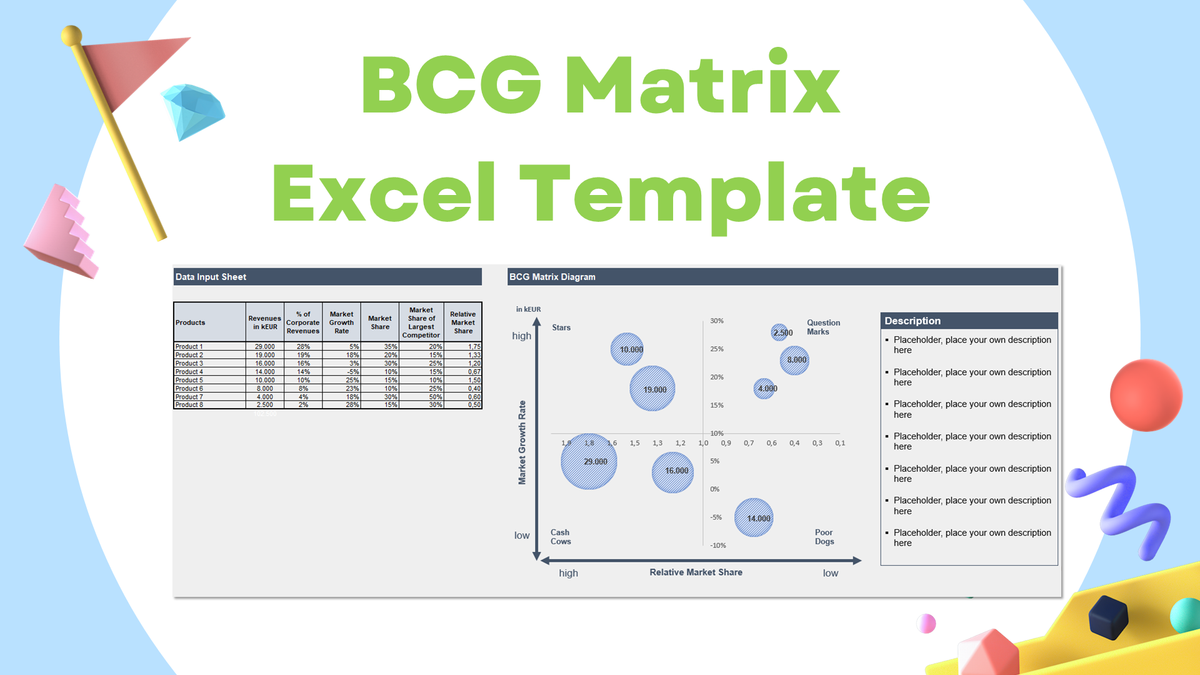
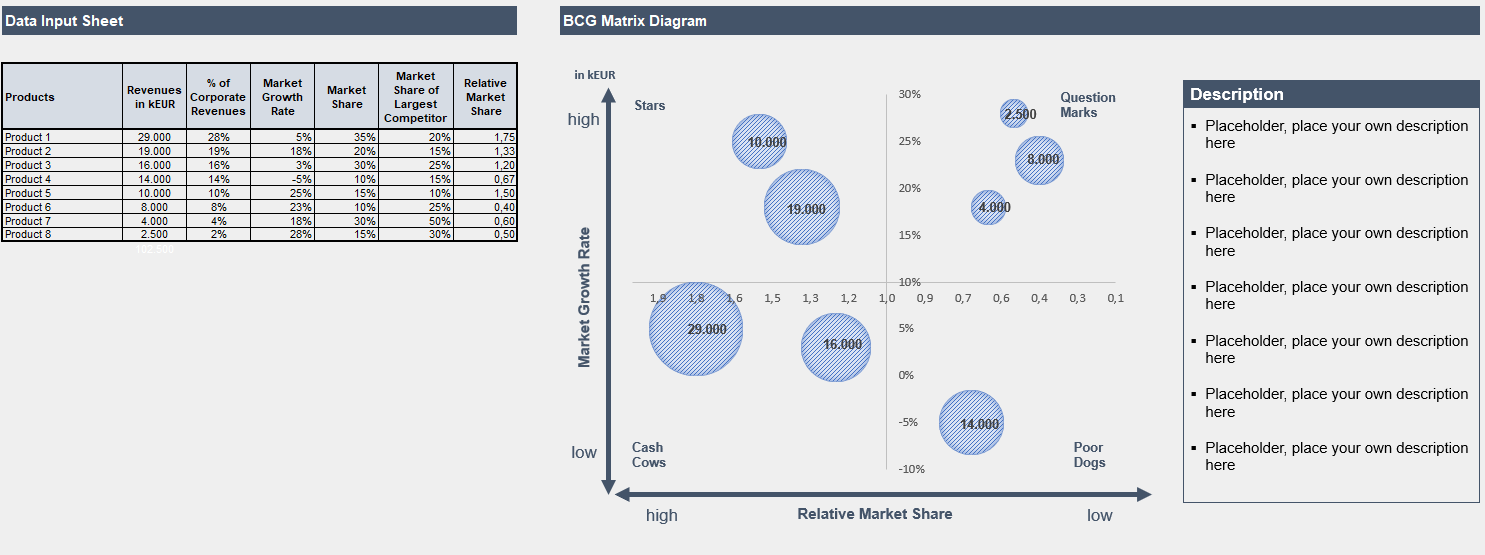
Step 0: Download and create the BCG matrix in Excel below
You can download the free and fully editable BCG Matrix Excel template below.
Step 1: Select the product or business unit
The BCG matrix may be used to analyze products, business units, brands, or a company as a whole. Specifying the team is required.
Step 2: Define the right market
A poorly defined market might result in poor product categorization. Precisely defining the market is required to better understand the portfolio position.
Step 3: Determine the respective market share
A company's market share compared to its most significant rival is referred to as relative market share (RMS). Market share is the percentage of revenue a company generates inside a specific market. Hence, close market share is the percentage of one company compared to the highest earner.
Step 4: Determine the market growth rate
Subtract the market size for year one from the market size for year two to calculate market growth. To convert to a percentage, divide the result by the market size for year one and multiply by 100.
Step 5: Complete the BCG Matrix diagram
The x-axis represents relative market share, while the y-axis represents the industry growth rate. Could you add the determined value combination to each product, business unit, or company diagram?
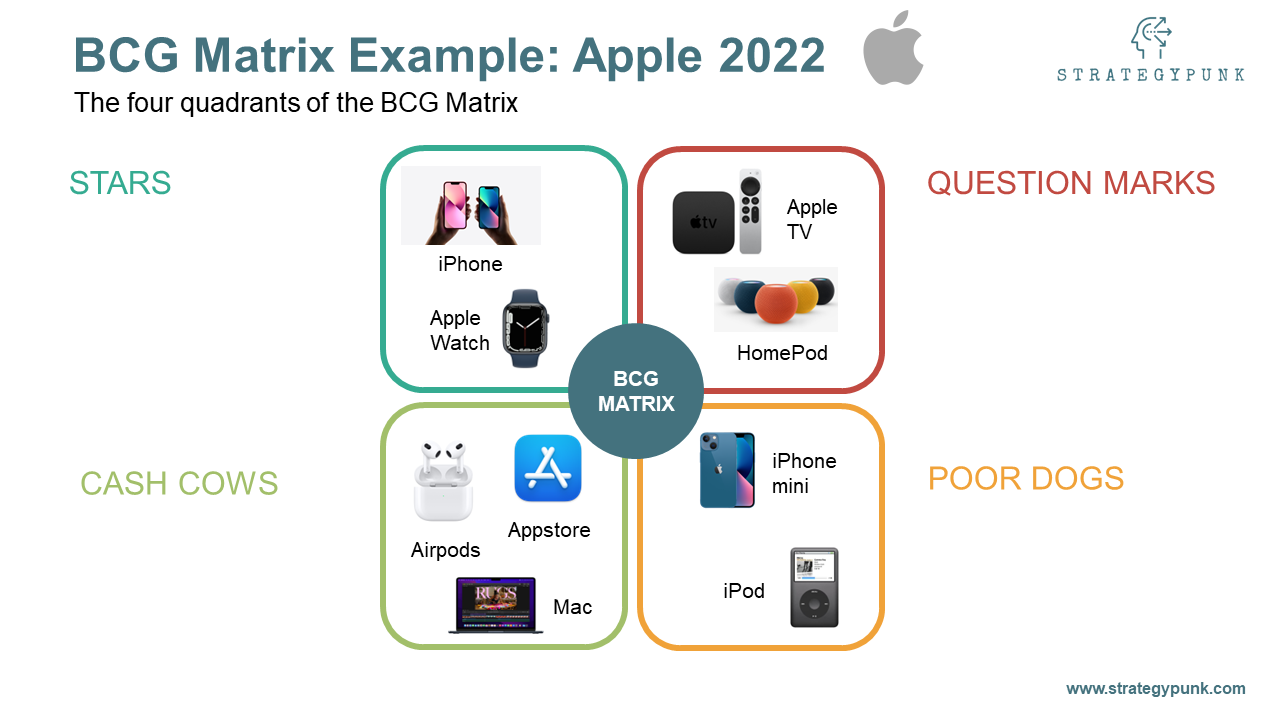
Examples of using the BCG Matrix: Apple
Consider the following BCG matrix example for an organization like Apple. Apple offers a wide range of products and services, from iPhones and Macs to the Apple Music subscription service.
- Stars would be the Apple iPhone or Apple Watch. Both products have a good market share and drive Apple's profits.
- Cash Cows would be their App Store, iTunes, MacBooks, iPads, or AirPods. They both require little investment and generate billions for Apple.
- Question Marks would be the Apple TV, Displays, and Home Pods. The products have to catch up. Time will tell if they will become stars or dogs.
- Dogs would probably be the iPod and the iPhone Mini. Sales for these products are declining, and there seems to be little room for growth.
How to use the BCG Matrix in Marketing
A BCG matrix can help decide how to allocate the marketing budget for the next financial year.
To allocate the marketing budget efficiently, the BCG matrix determines which products are in which category.
Products will range from low to high in terms of growth potential.
Similarly, the products are also ranked from low to high in terms of difficulty to market.
Once you have decided on your product categories, you need to determine the marketing budget you want to allocate for each type.
Get the Most Out of Your Resources: Why is the BCG Matrix still practical and relevant?
The BCG Matrix is still effective primarily because it helps firms to focus on their core business.
It helps managers determine which industries to focus on and which to avoid. It also helps them decide where to invest their resources—in the core business or an emerging company.
The core business is the market segment in the upper left quadrant (low share, high growth), and the emerging company is the market segment in the lower right quadrant (high percentage, low growth).
The core business is already established with a high market share, and you would want to invest in it to increase its growth and profits. The emerging company is expanding in the market segment. You want to invest in it to grow it into a core business.
What is a significant limitation of the BCG matrix?
The BCG Matrix has been criticized for being too simplistic. It doesn’t consider all factors influencing growth, such as product quality and price, and ignores the overall industry environment.
The BCG Matrix assumes a high market share only sometimes leads to increased profits. Growth rate and relative market share are not the only indicators of profitability.
Typical BCG Matrix Use Cases
Create transparency regarding the company’s business units, product, or brand portfolios. Reduce complexity within our strategic analysis and discussions.
Apply the BCG Matrix to evaluate strategic directions based on the current portfolio structure while balancing the investment needs between exploring new business segments and exploiting established details.
The Excel template is free and fully editable. It can be used for
- business plan analysis
- strategy assessments
- Info teasers for acquisitions projects
- M&A investor decks
- Due Diligence analysis
- Corporate strategy presentations
- workshops
- University case studies
BCG Matrix Excel Template
StrategyPunk offers free access to the BCG Matrix Excel tool, including a PDF introduction.
You can look no further than the BCG Matrix Excel template and PDF introduction.
The Excel template is fully editable and will help you make informed decisions about your company strategy.