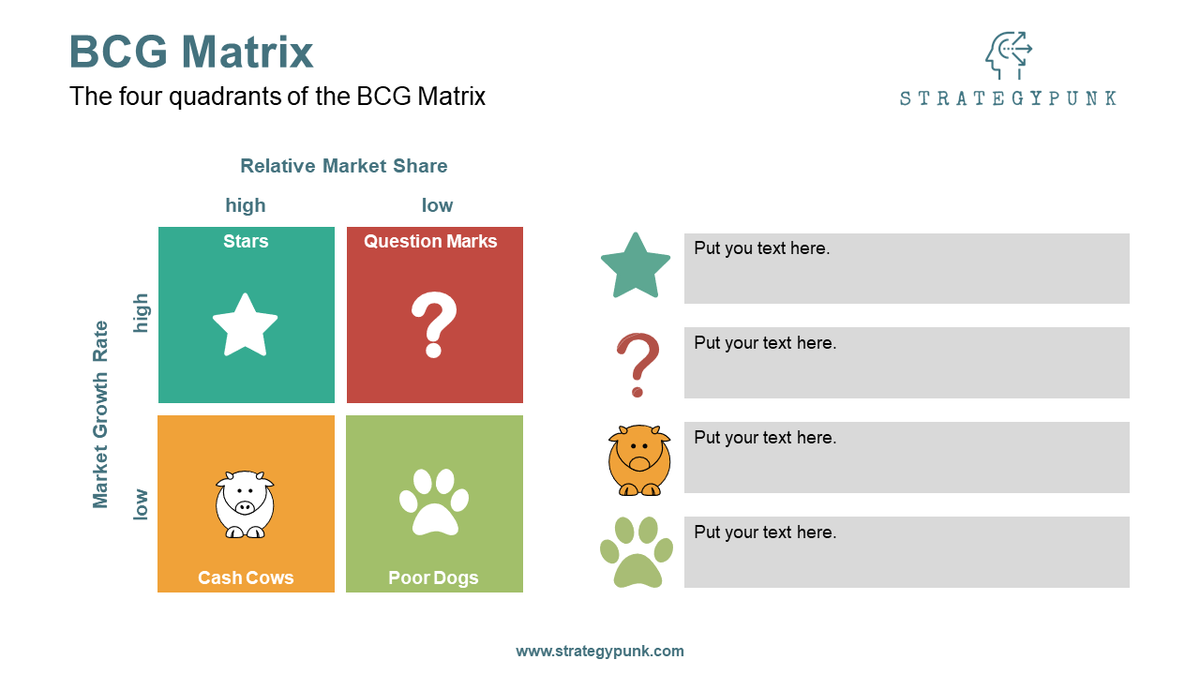
BCG Matrix: Free PowerPoint Template


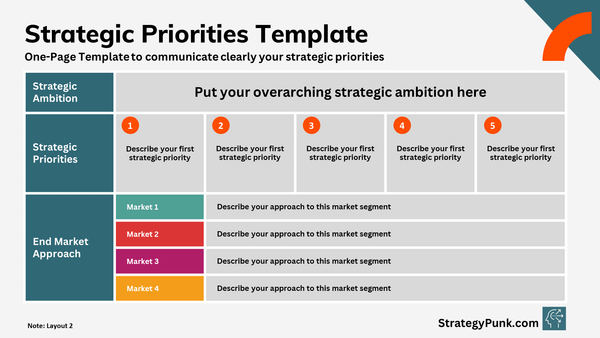
Achieve strategic ambitions with our free PowerPoint template: 'Strategic Priorities One-Pager' Simplify goal setting and boost efficiency. Download now!
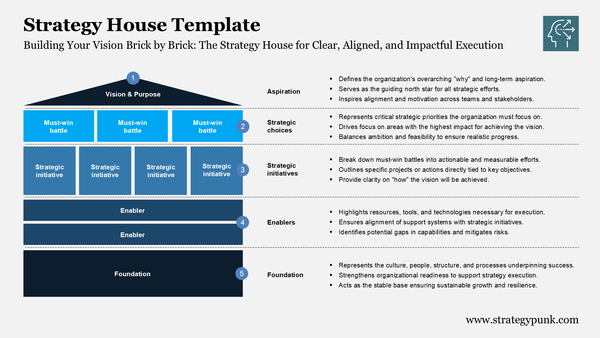
Master the Strategy House Framework! Learn how to align your team & goals. Download our free PDF & PPT template now!
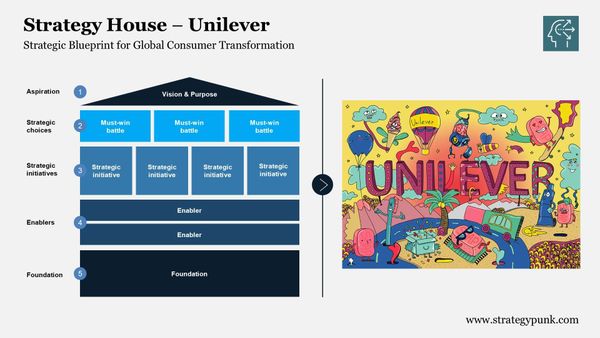
Unilever's McKinsey Strategy House 2030: Power brands, AI & sustainability roadmap. Free PDF & PPT download inside!
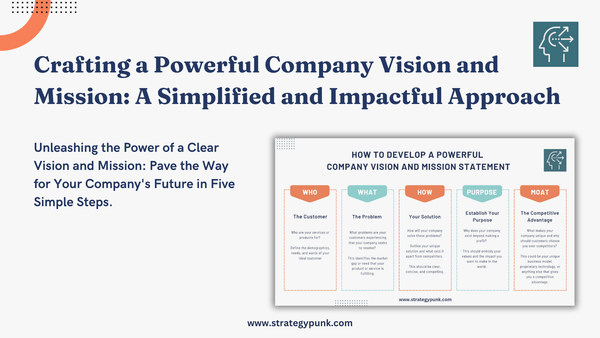
Unlock success with a clear vision and mission statement for your business. Follow our five-step guide to transform your company's future today. Download the FREE PDF & PowerPoint Template at the end of the post.