Market Attractiveness vs Ability to Win Matrix: Excel Template
The Market Attractiveness vs Ability to Win Matrix helps leadership teams decide where to invest, where to hold, and where to exit. Includes a free Excel template to score your own portfolio and generate the bubble chart automatically.

Introduction
Every business leader faces the same problem: too many opportunities, not enough resources. Every market segment promises potential. Every product line demands investment. Every initiative competes for attention.
Without a clear way to prioritise, organisations spread themselves too thin. They chase average opportunities and neglect the best ones.
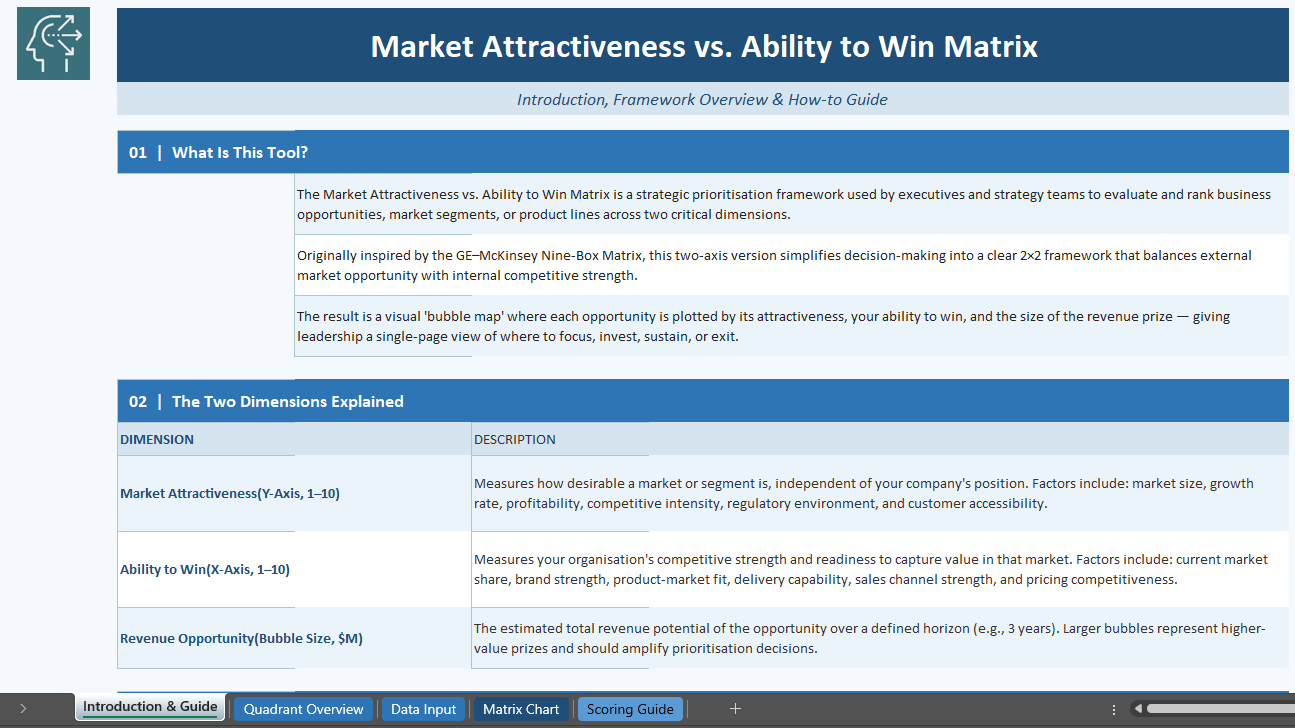
The Market Attractiveness vs Ability to Win Matrix solves this. Built on the logic of the GE-McKinsey Nine-Box Matrix, this two-axis framework turns complex portfolio decisions into a single clear visual.
It answers the question every executive team must face: where should we focus energy, capital, and talent?
See also our Market Attractiveness vs Ability to Win Matrix PowerPoint Slide Deck
The Logic Behind the Framework
Most leaders evaluate opportunities through a single lens. Market size alone. Or competitive position alone. This matrix forces you to consider both at once.
A market might be large and growing fast. But if your organisation cannot compete there, investment becomes a waste. The reverse is also true. Dominating a declining market generates cash today but leads nowhere tomorrow.
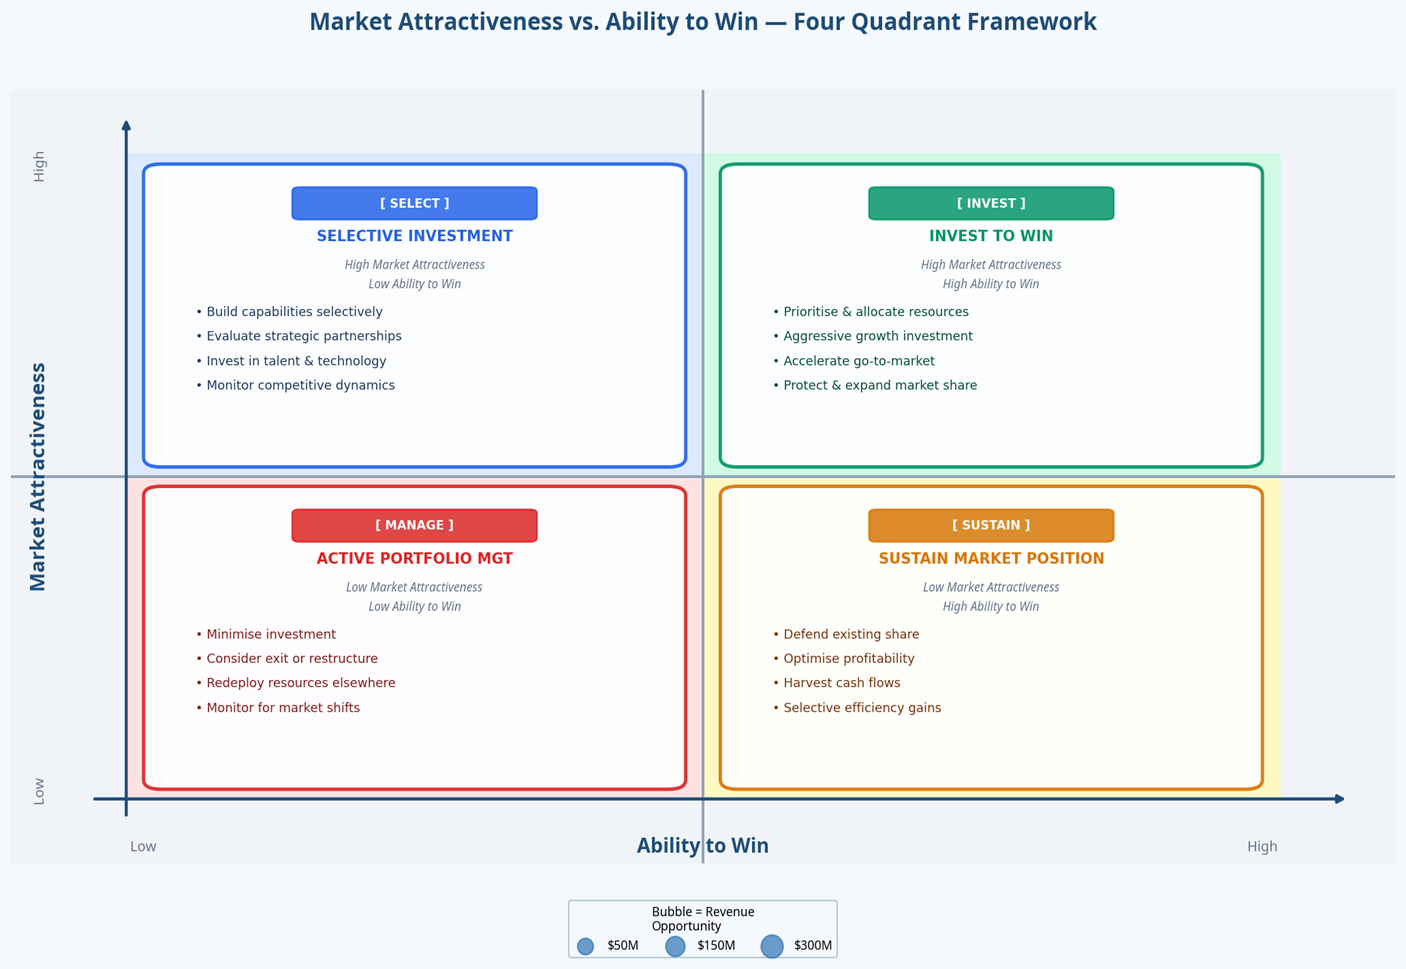
The matrix plots opportunities across two dimensions as a bubble chart.
The vertical axis measures Market Attractiveness: the external appeal of the opportunity, independent of your company.
The horizontal axis captures Ability to Win: your competitive strength in that specific market. Bubble size represents Revenue Opportunity, so high-value targets stand out in the discussion.
Market Attractiveness: The External View
Market Attractiveness asks one question: if we could compete here with full capability, would this market be worth winning?
Several factors drive the answer.
Market size and growth rate form the foundation. A large, expanding market gives room for multiple players and creates natural revenue tailwinds. But size alone can mislead. Profitability matters just as much. Some markets generate strong revenue but thin margins due to commoditisation or structural cost pressure. The best opportunities combine scale with strong economics.
Competitive intensity shapes how hard you fight for every point of share. Markets with entrenched players, low barriers to entry, or constant price wars score lower regardless of size.
Customer accessibility adds another layer. A market loses appeal if customers are locked into contracts, resistant to switching, or hard to reach through your channels.
Regulatory environment and technology disruption round out the picture. Supportive regulation opens doors. Heavy compliance burdens close them. Markets facing disruption from new technologies may look strong today, but could disappear tomorrow.
Scoring Market Attractiveness requires discipline. Teams tend to inflate scores based on optimism rather than evidence. The fix is cross-functional calibration. Bring sales, marketing, product, and finance together to challenge assumptions and ground scores in data.
Ability to Win: The Internal View
Ability to Win turns the lens inward. Given the competitive landscape and your current capabilities, can you realistically capture meaningful share?
Current market share provides a starting point. An existing foothold means you have cleared initial barriers and demonstrated some product-market fit. But share alone does not guarantee future success. Markets evolve.
Brand strength and reputation matter in markets where trust and track record influence buying decisions.
Product market fit sits at the centre of competitive advantage. Does your solution solve the customer problem better than alternatives? Is the value proposition clear and differentiated?
Sales and channel strength determine whether you can convert an opportunity into revenue. A strong product fails without the go-to-market capability to reach buyers and close deals at scale.
Delivery capability separates winners from pretenders. Can you execute consistently, at the quality and volume the market demands?
Pricing competitiveness reflects your cost structure and positioning. If you are structurally more expensive without matching value, winning becomes difficult.
Strategic relationships and partnerships amplify your ability to compete. They provide access, credibility, and leverage that would take years to build on one's own.
Scoring Ability to Win demands honesty. Teams tend to overestimate internal strengths, especially when evaluating opportunities their own team champions. The fix is evidence: pipeline data, win-loss analysis, customer feedback, and competitive benchmarking. If you score yourself an 8 but lose two-thirds of competitive deals, the data tells a different story.
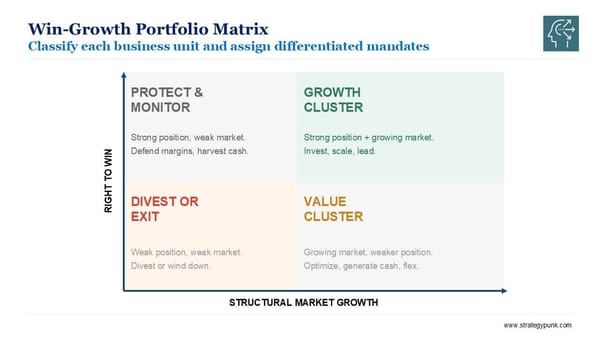
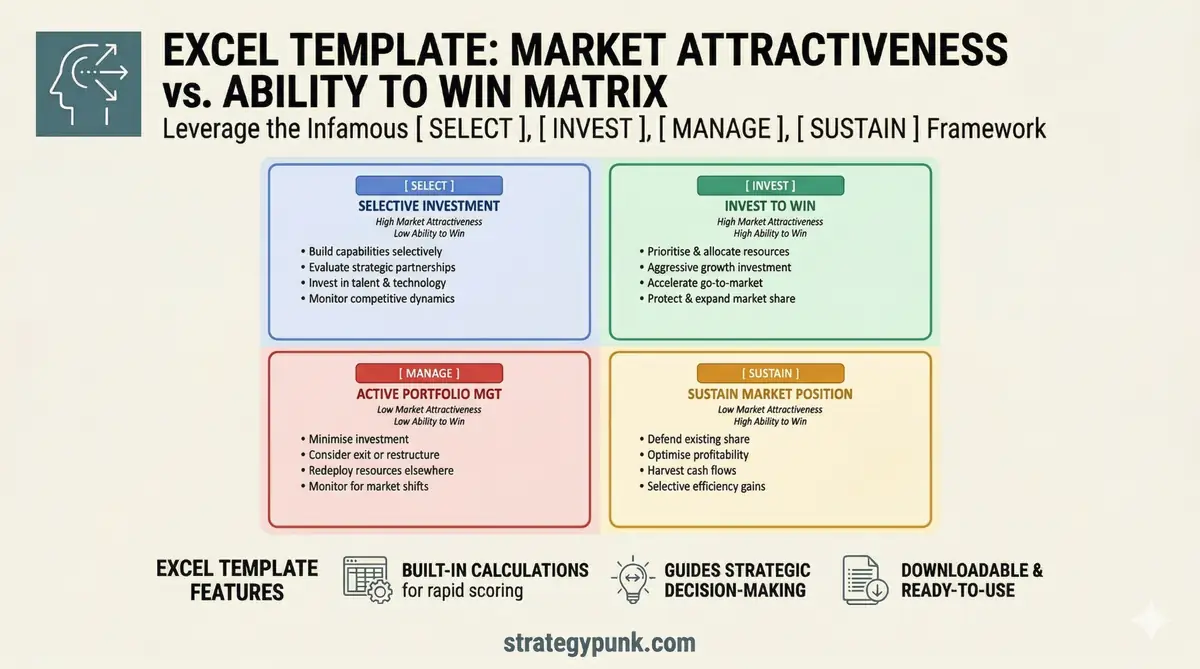
The Four Strategic Quadrants
Once plotted, the matrix reveals four zones. Each demands a different approach.
Invest to Win (Upper Right)
High Market Attractiveness. High Ability to Win.
These are your best opportunities. External conditions align with internal strength. The action is clear: allocate maximum resources, accelerate execution, protect your position.
Give these opportunities your best talent, strongest capital commitment, and senior leadership attention. Set ambitious targets. Invest in brand and thought leadership. Consider acquisitions to extend your lead. Track progress closely.
The risk here is not overinvestment. It is complacency. Competitors will target your best markets.
Selective Investment (Upper Left)
High Market Attractiveness. Low Ability to Win.
These markets look strong, but you are not yet positioned to compete. They represent future growth engines, but only if you close the capability gap.
Please identify the specific weakness: product, brand awareness, sales coverage, or delivery capacity. Pilot with a focused team before committing at scale. Explore partnerships or acquisitions that could accelerate progress. Build reference customers.
Set clear milestones. If you are not measurably more competitive within 12 to 18 months, reassess. The risk is spending heavily before you have the fundamentals to compete.
Sustain Market Position (Lower Right)
Low Market Attractiveness. High Ability to Win.
You are strong here, but the market itself offers limited upside. Often, these are mature or declining markets in which you have built a defensible position over time.
Shift focus from growth to optimisation and cash generation. Protect key accounts. Improve delivery efficiency to raise margins. Use the cash to fund investments in higher-growth quadrants. Upgrade offerings selectively to extend product lifecycle.
Monitor for signals that the market could reaccelerate. The risk is overextending the business and eroding your position early, or continuing to invest as if it were still a growth market.
Active Portfolio Management (Lower Left)
Low Market Attractiveness. Low Ability to Win.
These are the difficult conversations. Opportunities here consume resources without proportionate return.
Minimise discretionary investment immediately. Evaluate exit or divestiture options. Please redeploy talent and capital to the better quadrants. If you keep the business, set strict profitability floors and review quarterly.
The risk is emotional attachment. Funding legacy businesses out of habit or sentiment rather than strategic logic.
How to Use the Matrix: A Practical Guide
The value comes not from the initial analysis but from how you integrate it into decisions.
Assemble the right team. This is not a solo exercise. Bring leaders from sales, marketing, product, delivery, and finance. Each function sees opportunities differently. The diversity improves both accuracy and buy-in.
List all opportunities. These might be market segments, product lines, service offerings, geographies, or customer verticals. Be comprehensive but focused. Ten to twenty opportunities provide enough detail without overwhelming the analysis.
Score each opportunity on both axes using a 1 to 10 scale. Use the full range. A score of 7 should mean "better than most of our opportunities," not "pretty good." Ground every score in evidence: market research, financial data, win-loss analysis, customer feedback. Relative scoring works best. You are trying to differentiate between opportunities.
Estimate the revenue opportunity for each, typically over a three to five-year horizon. This drives bubble size. Use TAM or SAM estimates adjusted for realistic share assumptions.
Run a structured strategy discussion. The visual distribution across quadrants often surfaces insights that spreadsheets hide. Challenge outliers. Debate resource allocation. Are you investing too much in Sustain or Active Portfolio Management while starving your Invest to Win opportunities?
Document decisions, owners, and next steps. Capture the strategic rationale, key assumptions, and open questions.
Treat the matrix as a living tool. Market conditions change. Capabilities evolve. Rescore quarterly or after major market shifts. Track how opportunities move across quadrants over time. This shows whether your strategic investments work and whether market conditions are developing as expected.
Common Pitfalls
Score inflation. Teams rate their own opportunities too highly due to optimism, politics, or a lack of benchmarking. Fix this with a challenge session where scores must be defended with data. If every opportunity scores above 7, you are not differentiating.
Ignoring small bubbles. A small but well-positioned opportunity may represent a beachhead into a new market or an early-stage category that will grow quickly. Size matters, but position and trajectory matter more for strategic options.
Treating the matrix as a verdict. The framework informs decisions. It does not make them. Quantitative scoring must be paired with qualitative judgment. A low-scoring opportunity might still justify investment for customer retention, ecosystem positioning, or learning value.
Failing to act. If the analysis reveals misallocated resources but nothing changes, the exercise becomes theatre. Strategy without execution is expensive planning.
Conclusion
The Market Attractiveness vs Ability to Win Matrix does not guarantee strategic success. But it creates a shared language for the most important conversations leadership teams must have. It forces trade-offs, surfaces assumptions, and aligns stakeholders around a common view of where to compete and how to win.
Companies that win choose deliberately, invest decisively, and reallocate with discipline. This matrix provides the clarity to do that.
Download the Free Excel Template
Put this framework to work with your own portfolio. The Excel template includes the scoring model for both axes, an automated bubble chart, and space for notes on each opportunity.
Replace the sample data with your actual markets and start the conversation with your team.
Includes
- Introduction & Guide
- Quadrant Overview
- Data Input Sheet
- Output Matrix Chart
- Scoring Guide
Sign in to download the template below (link appears after sign in).