How to Turn a SWOT Analysis into a Strategy: The Bridge Framework
A SWOT analysis identifies four variables. It does not connect them. The SWOT to Strategy Bridge framework cross-references internal capabilities with external conditions to generate four strategic postures: SO (aggressive growth), ST (defensive moves), WO (transformation), and WT (risk mitigation).

The SWOT Strategy Framework: From Analysis to Action
Organizations face markets in motion. Strategy requires structure. The SWOT analysis provides baseline data. It lists strengths, weaknesses, opportunities, and threats. This list lacks direction. Data without action produces zero value. The SWOT to Strategy Bridge solves this problem. It converts observations into plans. This article explains the methodology. It provides a structured approach for business leaders and analysts.
The Problem with Traditional SWOT Analysis
Many companies conduct SWOT analyses. They brainstorm internal strengths. They list internal weaknesses. They identify external opportunities. They document external threats. The process stops there. Teams review the document. They file it away. The business continues operating without changes.
A list is not a strategy. Strategy demands choices. Strategy requires resource allocation. A traditional SWOT analysis provides observations. It fails to dictate action. The framework identifies components. It does not connect them. Leaders need a mechanism. They must link internal capabilities with external realities. They must build a bridge between the current and future states. They must convert observations into directives.
The failure rate of strategic planning is high. Companies spend months analyzing data. They hire consultants to validate findings. They produce reports. Yet execution fails. The failure occurs at the translation point. Teams struggle to translate findings into tasks. They lack a structured method to cross-reference variables. The traditional SWOT analysis isolates variables. It treats strengths as independent entities. It treats threats as isolated events. This isolation creates blind spots. Organizations miss critical intersections.
The Solution: The SWOT to Strategy Bridge
The Strategy Bridge transforms observations into actions. It uses a matrix structure. It cross-references internal factors with external factors. This intersection creates strategic options. The framework generates four distinct quadrants. Each quadrant dictates a specific posture.
- SO Quadrant: Strengths and Opportunities
- ST Quadrant: Strengths and Threats
- WO Quadrant: Weaknesses and Opportunities
- WT Quadrant: Weaknesses and Threats
Organizations use this matrix to formulate initiatives. The process forces connections. It prevents isolated thinking. It forces leaders to evaluate combinations. It demands synthesis. It produces actionable directives.
The SO Quadrant: Aggressive Growth
The SO quadrant represents maximum leverage. It combines internal strengths with external opportunities. This intersection signals aggressive growth. Organizations must capitalize on these conditions. They must deploy capital to exploit advantages. They must capture market share.
Leaders ask a core question. How can strengths capture opportunities? The answer defines the growth strategy. Companies use existing assets. They deploy resources to exploit market gaps. They expand market share. They launch new products. They enter new territories. They acquire competitors. They dominate the sector.
Consider Patagonia. Its strength is brand authenticity. An opportunity is the secondhand market. The strategy dictates expansion. Patagonia scales its Worn Wear program. It builds a peer-to-peer resale platform. It uses its sustainability credentials to capture market share. This approach maximizes return on investment. It accelerates growth. It solidifies market leadership. The company scales operations. It captures new demographics. It dominates the niche.
The ST Quadrant: Defensive Moves
The ST quadrant focuses on protection. It combines internal strengths with external threats. This intersection signals defensive moves. Organizations must protect their market position. They must build barriers. They must insulate core operations.
Leaders ask one question. How can strengths neutralize threats? The answer defines the defense strategy. Companies deploy assets to mitigate risks. They build barriers to entry. They secure supply chains. They lock in customers. They patent innovations. They lobby regulators.
Consider Patagonia. Its strength is its mission structure. A threat is greenwashing scrutiny. The strategy involves radical transparency. Patagonia leverages its Holdfast Collective ownership model. It expands third-party certifications. It uses its structure to neutralize regulatory threats. This approach shields revenue. It maintains margins. It protects profitability. The brand avoids commoditization. It sustains premium pricing. It secures market position.
The WO Quadrant: Transformation
The WO quadrant demands change. It combines internal weaknesses with external opportunities. This intersection signals transformation. Organizations must overcome limitations to grow. They must evolve. They must adapt.
Leaders ask one question. How must weaknesses be addressed to unlock opportunities? The answer defines the transformation strategy. Companies acquire new capabilities. They partner with other firms. They restructure operations. They invest in training. They upgrade systems. They pivot business models.
Consider Patagonia. Its weakness is a narrow product range. An opportunity is the growing outdoor recreation market. The strategy requires investment. Patagonia expands into hard goods. It develops footwear. It transforms its product lineup to serve the complete outdoor journey. This approach removes bottlenecks. It enables future growth. It modernizes the enterprise. It restores competitiveness. The firm captures full-trip spend.
The WT Quadrant: Risk Mitigation
The WT quadrant highlights vulnerability. It combines internal weaknesses with external threats. This intersection signals risk mitigation. Organizations must survive. They must stop bleeding. They must cut losses.
Leaders ask one question. How can weaknesses be minimized to avoid threats? The answer defines the survival strategy. Companies divest assets. They exit markets. They form alliances. They reduce costs. They consolidate operations. They liquidate divisions.
Consider Patagonia. Its weakness is a concentrated supply chain. A threat is geopolitical instability. The strategy dictates geographic diversification. Patagonia accelerates nearshoring. It shifts production to Portugal and Mexico. It invests in supplier auditing technology. It reduces exposure. It avoids disruption. It pivots to a resilient model.
Implementing the Framework
Implementation requires discipline. The process follows five steps. Organizations must execute each step with precision. They must adhere to the methodology. They must avoid shortcuts.
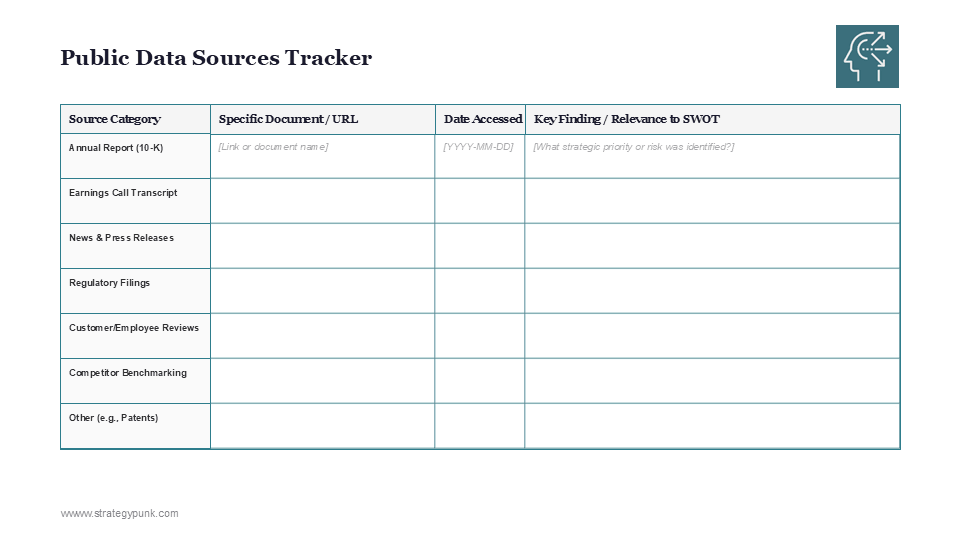
Step One: Gather Data
Leaders collect data. They analyze market trends. They assess competitor actions. They review financial metrics. They survey customers. Data replaces assumptions. Facts replace opinions. Organizations must audit internal capabilities. They must evaluate talent. They must assess technology infrastructure. They must review brand equity. They must analyze supply chain resilience. They must measure customer satisfaction. They must quantify market share. They must track regulatory shifts. They must monitor macroeconomic indicators. They must synthesize industry reports.
Step Two: Categorize Factors
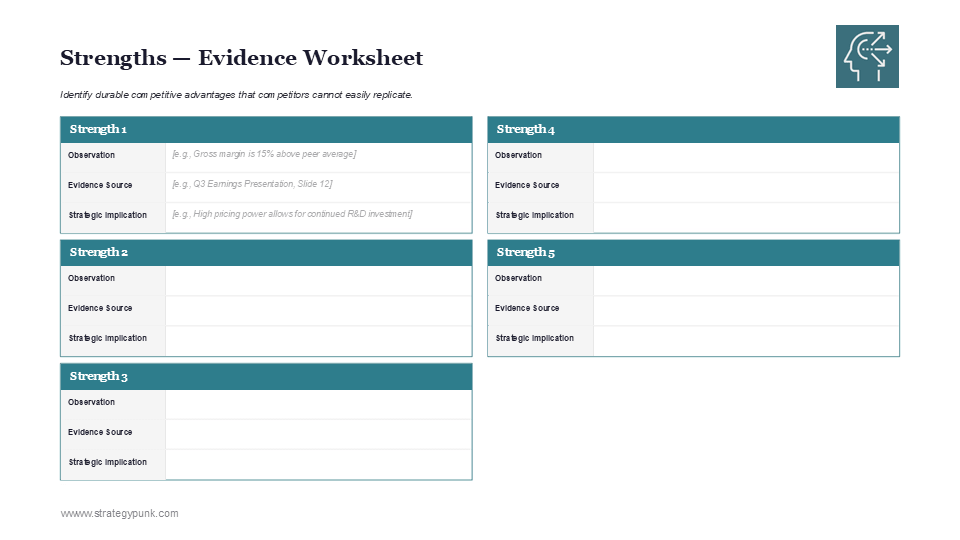
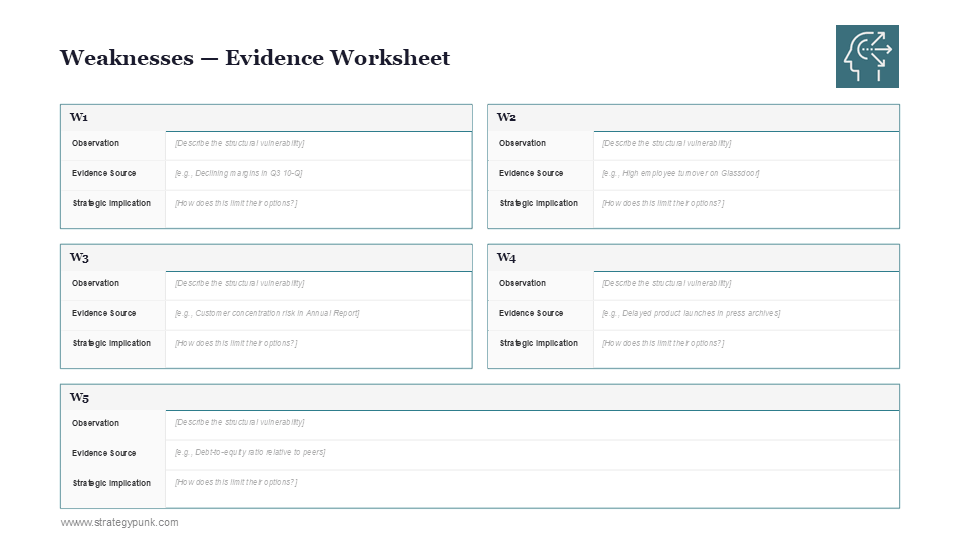
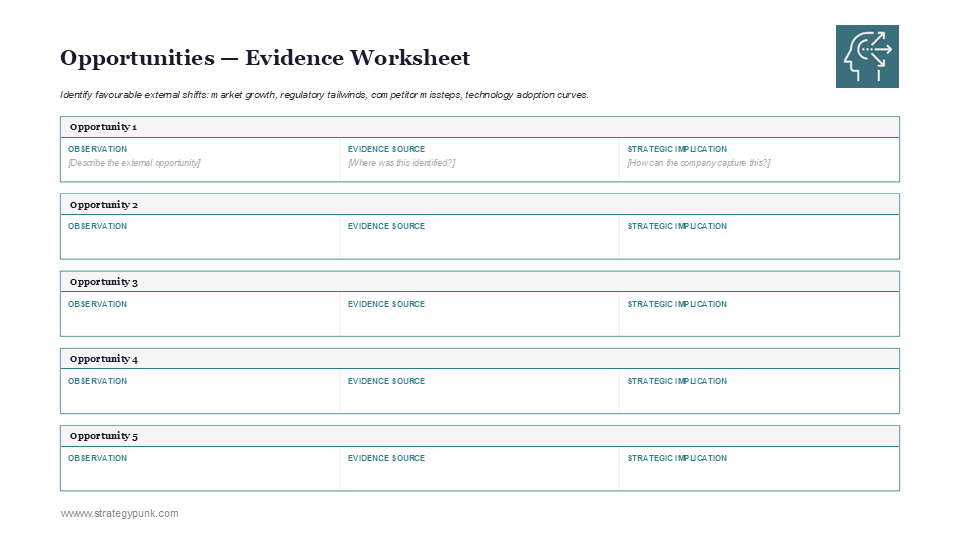
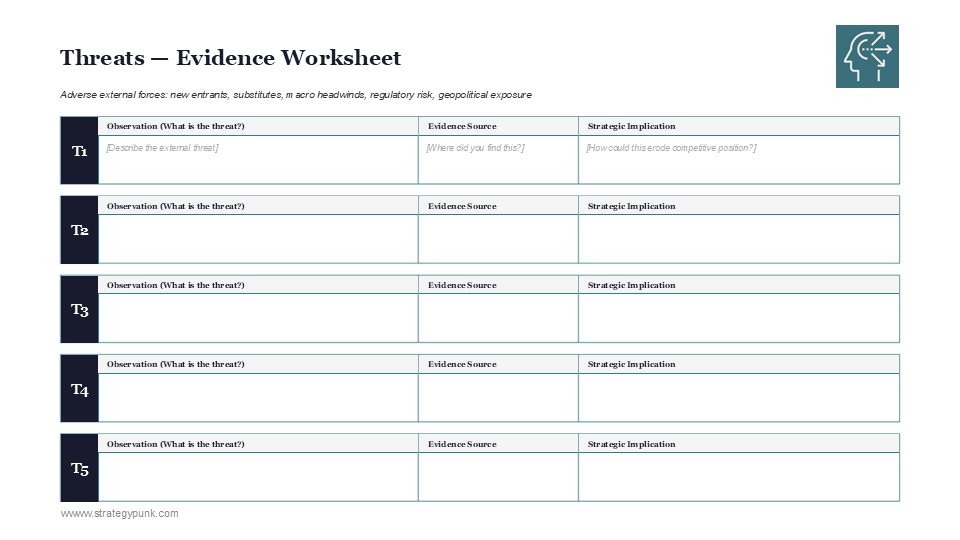
Teams categorize the data. They separate internal factors from external factors. They define strengths. They identify weaknesses. They list opportunities. They document threats. The categorization must be precise. Teams must avoid ambiguity. They must use specific language. They must quantify factors where possible. They must rank items by impact. They must filter noise. They must focus on material variables. They must establish clear definitions. They must agree on terminology. They must eliminate overlap.
Step Three: Cross-Reference
Leaders use the matrix. They map strengths against opportunities. They map strengths against threats. They map weaknesses against opportunities. They map weaknesses against threats. This step generates strategic options. Teams must explore all combinations. They must document ideas. They must evaluate synergies. They must identify conflicts. They must synthesize findings. They must generate a list of options. They must avoid premature filtering. They must encourage diverse perspectives. They must challenge assumptions.
Step Four: Formulate Initiatives
Teams draft initiatives. They use the matrix outputs. Each initiative must be actionable. Each initiative must have clear metrics. Each initiative must assign responsibility. Teams must define scope. They must establish timelines. They must allocate budgets. They must identify dependencies. They must outline deliverables. They must set milestones. They must define success criteria. They must assign project managers. They must secure executive sponsorship.
Step Five: Prioritize Actions
Organizations cannot execute every initiative. Resources are finite. Leaders must prioritize. They evaluate impact. They assess feasibility. They allocate capital to projects with the highest return. They discard projects with low return. They must use scoring models. They must calculate return on investment. They must evaluate risk profiles. They must align initiatives with corporate goals. They must sequence projects logically. They must balance near-term gains with long-term objectives. They must create a roadmap. They must communicate priorities. They must secure stakeholder buy-in.
Benefits of the Strategy Bridge
The Strategy Bridge offers four advantages. It improves decision making. It aligns teams. It optimizes resource allocation. It creates accountability.
Improved Decision Making
The framework forces logical connections. It removes emotion from the process. Leaders base decisions on data intersections. The logic is transparent. The rationale is clear. Organizations avoid consensus-driven mediocrity. They avoid errors rooted in intuition. They rely on structured analysis. They make objective choices. They defend decisions with data. They track outcomes against hypotheses. They refine models based on results. They build institutional knowledge.
Team Alignment
The matrix provides a visual tool. Teams see the connections. They understand the rationale behind initiatives. This transparency builds consensus. It reduces friction. It accelerates execution. Departments break down silos. They collaborate on cross-functional initiatives. They share resources. They align incentives. They work toward common goals. They execute with purpose. They deliver results.
Resource Optimization
The framework highlights leverage points. Organizations focus resources on areas with the highest return. They avoid wasting capital on isolated projects. They maximize return on investment. They eliminate redundant initiatives. They consolidate overlapping projects. They sequence investments logically. They match talent to strategic priorities. They align budgets with growth drivers. They measure capital efficiency. They reallocate resources as markets shift. They maintain financial discipline.
Execution Accountability
The framework demands initiatives with clear metrics. It assigns distinct responsibilities. This structure creates accountability. Leaders track progress. They measure performance. They hold teams responsible. Organizations avoid vague goals. They avoid ambiguous directives. They establish clear expectations. They monitor milestones. They conduct reviews. They adjust tactics based on feedback. They reward success. They address underperformance. They deliver measurable value.
Advanced Application Techniques
Organizations can enhance the framework. They can integrate the model with other tools. They can adapt the methodology to specific contexts. They can scale the approach across divisions. They can embed the process in corporate governance.
Integration with OKRs
Organizations link the matrix to Objectives and Key Results. They translate strategic initiatives into OKRs. This integration bridges strategy and execution. It aligns daily operations with long-term goals. It ensures alignment across all levels. It creates a management system. It drives focus. It measures progress. It fosters accountability.
Scenario Planning
Leaders use the matrix for scenario planning. They alter external variables. They simulate market shocks. They evaluate the impact on strategic options. They develop contingency plans. They build resilience. They prepare for volatility. They anticipate competitor moves. They model regulatory changes. They test assumptions. They stress test the strategy. They mitigate downside risk.
Divisional Cascading
Large enterprises cascade the framework. They apply the model at the corporate level. They apply the model at the divisional level. They apply the model at the product level. This cascading ensures alignment. It tailors strategy to specific contexts. It empowers local leaders. It maintains corporate cohesion. It drives execution at every level. It optimizes performance across the portfolio.
Conclusion
The SWOT analysis is incomplete. It provides data without direction. The Strategy Bridge completes the process. It transforms lists into plans. It connects internal capabilities with external realities. It generates initiatives. Organizations use this framework to navigate markets. They achieve growth. They execute defensive moves. They drive transformation. They mitigate risks. Strategy requires structure. The Strategy Bridge delivers it. Organizations must adopt this methodology. They must abandon static lists. They must connect analysis to action. They must execute with precision. The Strategy Bridge provides the blueprint. Leaders must build the bridge. They must capture the future.
Download the Strategy Bridge Framework
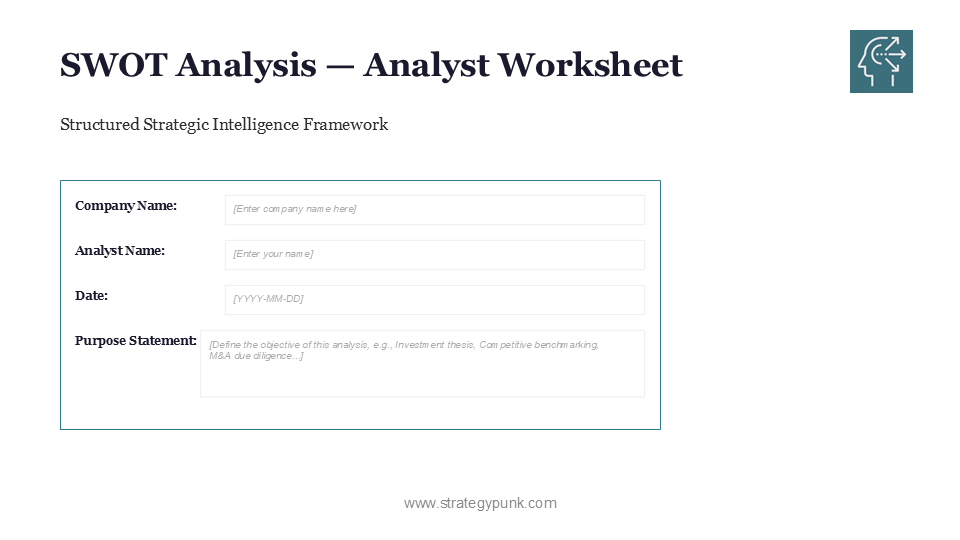
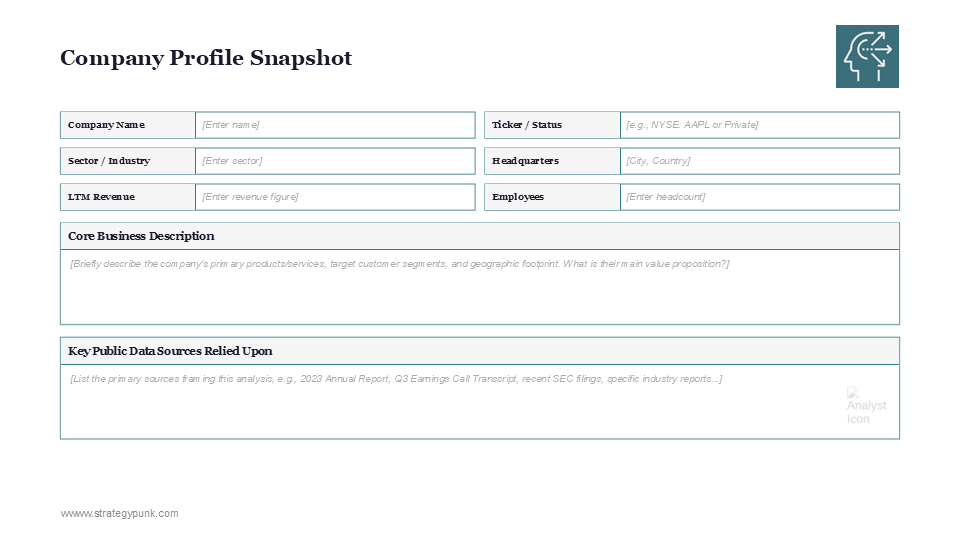
The theory requires application. Teams need tools to execute this methodology. The framework demands a structured approach. It requires clean templates. It demands precise categorization.
Download the free PDF guide below. The guide includes the complete SWOT to Strategy matrix. It provides blank worksheets for team workshops. It includes the Patagonia case study for reference. It delivers the exact templates required to move from analysis to action. Stop filing SWOT lists. Start building strategies. Download the framework today.
SWOT to Strategy Bridge Framework
Download the Free SWOT to Strategy PDF Guide Here